

CIT Group, Inc. (CIT - Get Rating) is a financial holding company, which provides financing, leasing and advisory services. It operates through the following business segments: Commercial Banking, Consumer Banking and Corporate.
Take a look at the 1-year chart of CIT below with added notations:
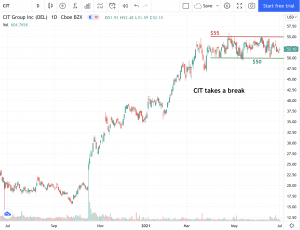
Chart of CIT provided by TradingView
After moving higher for the better part of 6 months, CIT has now moved into a sideways trading range. While in its range, the stock has formed a resistance level at $55 (red) and a level of support at $50 (green).
CIT is sitting in the middle of that range now, but at some point the stock will have to either break the resistance or the support.
Click Here to Read the Greatest Trading Book Ever Written
The possible long position in the stock is on a breakout above $55. The ideal short opportunity would be on a break below $50.
Want to Discover More Great Trades?
I have explored virtually every flavor of technical analysis and chart pattern known to mankind. The sad fact is that the vast majority of them don’t work at all.
That is why I recently put together this special report to help investors focus on the only 5 chart patterns that matter…the ones that lead to the most timely and profitable stock trades. Click below to get your copy now!
5 WINNING Stock Chart Patterns
Have a good trading day!
Good luck!
Christian Tharp, CMT
Want More Great Investing Ideas?
CIT shares were unchanged in premarket trading Friday. Year-to-date, CIT has gained 47.43%, versus a 16.24% rise in the benchmark S&P 500 index during the same period.
About the Author: Christian Tharp

I am an expert stock market coach having helped over 4000 beginner and advanced traders & investors from around the world take control of their financial futures. I also write stock market related articles for the Adam Mesh Trading Group and Yolo Publishing. More...
More Resources for the Stocks in this Article
| Ticker | POWR Rating | Industry Rank | Rank in Industry |
| CIT | Get Rating | Get Rating | Get Rating |


