

When analyzing charts this weekend, I discovered that over the past 6 months a trendline has formed in Facebook’s (FB - Get Rating) chart.
FB is the world’s largest online social network, with 2.5 billion monthly active users. The firm’s ecosystem consists mainly of the Facebook app, Instagram, Messenger, WhatsApp, and many features surrounding these products.
The company has been benefiting from strong user growth, particularly in the Asia Pacific Region. Increased engagement in products such as Instagram, Messenger, and WhatsApp is a major growth catalyst for the company.
FB has a strong cash balance, with $55.6 billion as of the end of the quarter, compared to long-term debt of $9.6 billion. The company also has a very healthy current ratio of 5.5. FB is also very profitable with a net margin of 32%.
Growth has been strong as well, with sales up an average of 37.7% over five years. Earnings are up an average of 54.7% over the same time period. While the stock’s P/E is slightly high at 31.9, it’s still lower than its industry average and the S&P 500.
The stock has shown strong long-term and decent near-term momentum, leading to a “Buy” rating in our proprietary POWR Ratings systems. Its long-term momentum is reflected in its price chart.
Take a look at the 1-year chart of FB below with my added notations:
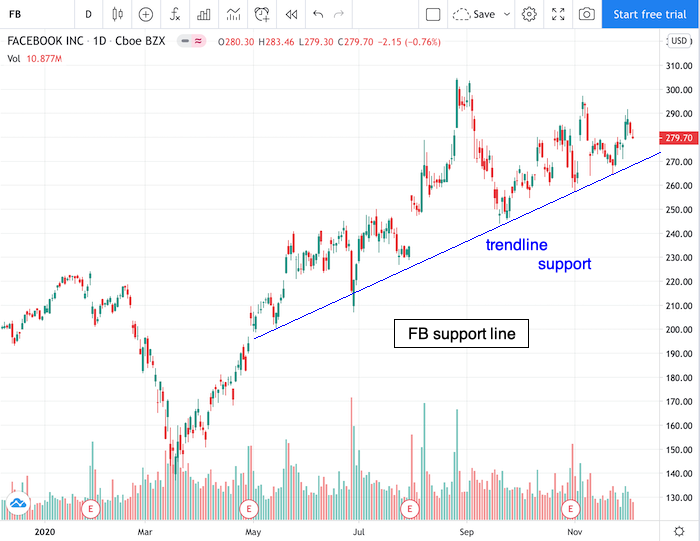
FB has been trending higher since bottoming in March, while also forming a nice trend line of support (blue) along the way. Any (2) points can start a trend line, but it’s the 3rd test and beyond that confirm its relevance. A pullback to the FB line provides trading opportunities, one way or another.
A long position could be entered on a pullback to the trendline, with a protective stop placed below the level of entry. And/or a short position could be entered if FB were to break below its trendline.
Want to Discover More Great Trades?
I have explored virtually every flavor of technical analysis and chart pattern known to mankind. The sad fact is that the vast majority of them don’t work at all.
That is why I recently put together this special report to help investors focus on the only 5 chart patterns that matter…the ones that lead to the most timely and profitable stock trades. Click below to get your copy now!
5 WINNING Stock Chart Patterns
Have a good trading day!
Good luck!
Christian Tharp, CMT
FB shares fell $0.56 (-0.20%) in premarket trading Monday. Year-to-date, FB has gained 36.08%, versus a 16.28% rise in the benchmark S&P 500 index during the same period.
About the Author: christian

Christian is an expert stock market coach at the Adam Mesh Trading Group who has mentored more than 4,000 traders and investors. He is a professional technical analyst that is a certified Chartered Market Technician (CMT), which is a designation awarded by the CMT Association. Christian is also the author of the daily online newsletter Todays Big Stock. More...
More Resources for the Stocks in this Article
| Ticker | POWR Rating | Industry Rank | Rank in Industry |
| FB | Get Rating | Get Rating | Get Rating |


