
Meta Platforms Inc. (FB): Price and Financial Metrics
FB Price/Volume Stats
| Current price | $196.64 | 52-week high | $384.33 |
| Prev. close | $195.65 | 52-week low | $169.00 |
| Day low | $194.41 | Volume | 22,267,100 |
| Day high | $202.03 | Avg. volume | 34,873,727 |
| 50-day MA | $203.24 | Dividend yield | N/A |
| 200-day MA | $280.50 | Market Cap | 532.17B |
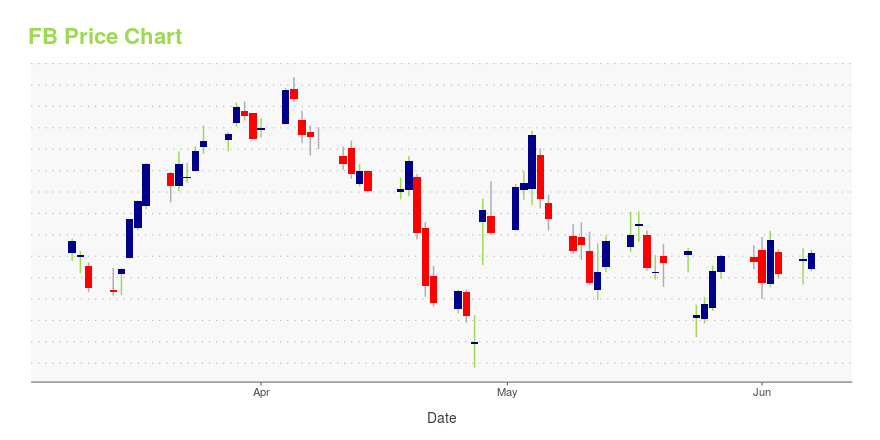
FB Stock Price Chart Interactive Chart >
Meta Platforms Inc. (FB) Company Bio
Meta Platforms, Inc., (formerly known as Facebook, Inc.) operates as a global social technology company. The company engages in the development of social media applications as well as virtual and augmented reality products allowing users to connect through mobile devices, personal computers and other platforms. The company operates through two segments. The Family of Apps (FOA) segment which includes Facebook, Instagram, Messenger, WhatsApp and other services, and the Reality Labs (RL) segment, which includes augmented and virtual reality related consumer hardware, software and content. The company was founded by Mark Elliot Zuckerberg, Dustin Moskovitz, Chris R. Hughes, Andrew McCollum, and Eduardo P. Saverin on February 4, 2004 and is headquartered in Menlo Park, CA.
FB Price Returns
| 1-mo | N/A |
| 3-mo | N/A |
| 6-mo | N/A |
| 1-year | N/A |
| 3-year | N/A |
| 5-year | N/A |
| YTD | N/A |
| 2023 | N/A |
| 2022 | N/A |
| 2021 | N/A |
| 2020 | N/A |
| 2019 | N/A |
Continue Researching FB
Here are a few links from around the web to help you further your research on Facebook Inc's stock as an investment opportunity:Facebook Inc (FB) Stock Price | Nasdaq
Facebook Inc (FB) Stock Quote, History and News - Yahoo Finance
Facebook Inc (FB) Stock Price and Basic Information | MarketWatch
Loading social stream, please wait...