

Fidelity National Financial Inc. (FNF - Get Rating) is engaged in providing title insurance and transaction services to real estate and mortgage industries. Its services include title insurance, escrow, and other title-related services, including trust activities, trustee sales guarantees, recordings, and reconveyances and home warranty products, and technology and transaction services to the real estate and mortgage industries.
The company has two business groups, FNF Core Operations, and FNF Ventures. The Core operations group provides escrow, insurance, and other titles related to service. FNF Ventures investors in other companies. Title insurance premiums make up almost half of FNF’s total revenue. The company is one of the largest title insurance providers in the nation.
FNF has strong financials. In Q4 2019, the company reported $2.4 billion in revenue, which was up from $1.7 billion in the previous year. The company beat earnings estimates with adjusted earnings per share of $0.95. This was up from $0.63 in the fourth quarter of 2018.
FNF recently diversified into the retirement business. It acquired FGL Holdings on February 7th. This should help the company in periods of economic distress that are challenging to title insurance.
The Tale of the Tape
Take a look at the 1-year chart of Fidelity National Financial Inc. below with the added notations:
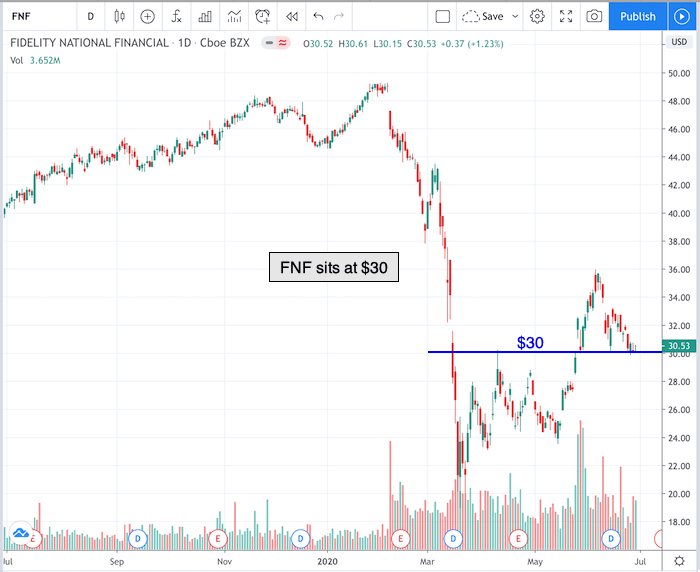
Chart of FNF provided by TradingView
FNF has formed an important level of support at the $30 mark (blue) over the past couple of months. The level was resistance back in April, support at the beginning of June, and now the stock is sitting at $30. FNF has not been able to rally off of, nor break, $30 could mean a big move is brewing.
A resistance level is a price point that a security such as a stock has trouble exceeding over a specific period of time. FNF has a key level at $30. A trader could enter a long position on a pullback down to that level with a stop placed under it.
The market has opened flat, so keep an eye on its resistance level. Make sure to set an alert for this stock so that you know when it’s five to ten percent away from its resistance level.
Before making any trading decision, decide which side of the trade you believe gives you the highest probability of success. Do you prefer the short side of the market, long side, or do you want to be in the market at all? If you haven’t thought about it, review the overall indices themselves. For example, take a look at the S&P 500. Is it trending higher or lower? Has it recently broken through a key resistance or support level? Making these decisions ahead of time will help you decide which side of the trade you believe gives you the best opportunities.
No matter your strategy or when you decide to enter, always remember to use protective stops, and you’ll be around for the next trade. Capital preservation is still key!
Good luck!
Christian Tharp, CMT
Stock Trading & Investing for Everyone
Want More Great Investing Ideas?
9 “BUY THE DIP” Growth Stocks for 2020
Is the Bull S#*t Rally FINALLY Over?
7 “Safe-Haven” Dividend Stocks for Turbulent Times
Top 3 Investing Strategies for 2020
FNF shares were trading at $30.53 per share on Tuesday morning, down $0.00 (0.00%). Year-to-date, FNF has declined -31.31%, versus a -4.16% rise in the benchmark S&P 500 index during the same period.
About the Author: christian

Christian is an expert stock market coach at the Adam Mesh Trading Group who has mentored more than 4,000 traders and investors. He is a professional technical analyst that is a certified Chartered Market Technician (CMT), which is a designation awarded by the CMT Association. Christian is also the author of the daily online newsletter Todays Big Stock. More...
More Resources for the Stocks in this Article
| Ticker | POWR Rating | Industry Rank | Rank in Industry |
| FNF | Get Rating | Get Rating | Get Rating |


