Fidelity National Financial Inc. (FNF): Price and Financial Metrics
FNF Price/Volume Stats
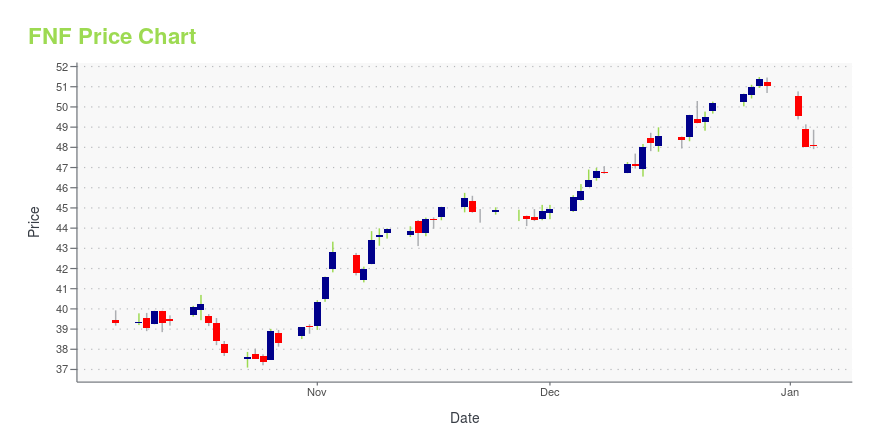
Current price | $35.83 | 52-week high | $45.51 |
Prev. close | $35.50 | 52-week low | $31.84 |
Day low | $35.44 | Volume | 1,864,000 |
Day high | $36.14 | Avg. volume | 1,514,403 |
50-day MA | $34.79 | Dividend yield | 5.12% |
200-day MA | $38.01 | Market Cap | 9.75B |
FNF Stock Price Chart Interactive Chart >
FNF POWR Grades
- Momentum is the dimension where FNF ranks best; there it ranks ahead of 87.05% of US stocks.
- FNF's strongest trending metric is Stability; it's been moving up over the last 179 days.
- FNF ranks lowest in Growth; there it ranks in the 10th percentile.
FNF Stock Summary
- Price to trailing twelve month operating cash flow for FNF is currently 1.84, higher than just 8% of US stocks with positive operating cash flow.
- Equity multiplier, or assets relative to shareholders' equity, comes in at 10.68 for FIDELITY NATIONAL FINANCIAL INC; that's greater than it is for 91.27% of US stocks.
- As for revenue growth, note that FNF's revenue has grown -30.83% over the past 12 months; that beats the revenue growth of only 7.8% of US companies in our set.
- Stocks that are quantitatively similar to FNF, based on their financial statements, market capitalization, and price volatility, are CBU, SMBC, AIZ, LAZ, and QCRH.
- Visit FNF's SEC page to see the company's official filings. To visit the company's web site, go to www.fnf.com.
FNF Valuation Summary
- In comparison to the median Financial Services stock, FNF's price/sales ratio is 0% higher, now standing at 0.9.
- FNF's EV/EBIT ratio has moved up 5.7 over the prior 214 months.
Below are key valuation metrics over time for FNF.
Stock | Date | P/S | P/B | P/E | EV/EBIT |
---|---|---|---|---|---|
FNF | 2023-05-19 | 0.9 | 1.5 | 13.9 | 10.1 |
FNF | 2023-05-18 | 0.9 | 1.5 | 14.1 | 10.2 |
FNF | 2023-05-17 | 0.9 | 1.5 | 13.8 | 10.0 |
FNF | 2023-05-16 | 0.9 | 1.5 | 13.6 | 9.9 |
FNF | 2023-05-15 | 0.9 | 1.5 | 13.8 | 10.0 |
FNF | 2023-05-12 | 0.9 | 1.5 | 13.8 | 10.0 |
FNF Growth Metrics
- The year over year revenue growth rate now stands at 28.06%.
- The year over year cash and equivalents growth rate now stands at -7.7%.
- Its 5 year net income to common stockholders growth rate is now at 22.69%.

The table below shows FNF's growth in key financial areas (numbers in millions of US dollars).
Date | Revenue | Operating Cash Flow | Net Income to Common Stock |
---|---|---|---|
2022-12-31 | 11,556 | 4,355 | 1,136 |
2022-09-30 | 13,800 | 4,467 | 1,601 |
2022-06-30 | 14,485 | 4,069 | 2,044 |
2022-03-31 | 15,708 | 4,092 | 2,214 |
2021-12-31 | 15,643 | 4,090 | 2,422 |
2021-09-30 | 14,616 | 3,213 | 2,690 |
FNF's Quality Factors
The “Quality” component of the POWR Ratings focuses on 31 different factors of a companies fundamentals and operational strength. Here are some key insights as we drill into the specifics of these quality attributes.- FNF has a Quality Grade of C, ranking ahead of 52.13% of graded US stocks.
- FNF's asset turnover comes in at 0.266 -- ranking 68th of 133 Insurance stocks.
- MTG, ESNT, and AIG are the stocks whose asset turnover ratios are most correlated with FNF.
The table below shows FNF's key quality metrics over time.
Period | Asset Turnover | Gross Margin | ROIC |
---|---|---|---|
2021-06-30 | 0.266 | 0.908 | 0.069 |
2021-03-31 | 0.246 | 0.932 | 0.063 |
2020-12-31 | 0.272 | 0.920 | 0.055 |
2020-09-30 | 0.316 | 0.957 | 0.054 |
2020-06-30 | 0.436 | 0.982 | 0.072 |
2020-03-31 | 0.806 | 1.000 | 0.157 |
FNF Price Target
For more insight on analysts targets of FNF, see our FNF price target page. And for a list of of all stocks sorted by upside potential based on analyst target price, see our Top Price Target page.
Average Price Target | $59.40 | Average Broker Recommendation | 1.5 (Moderate Buy) |
Fidelity National Financial Inc. (FNF) Company Bio
Fidelity National Financial, Inc. (NYSE: FNF), a Fortune 500 company, is a provider of title insurance and settlement services to the real estate and mortgage industries. FNF generated approximately $8.469 billion in annual revenue in 2019 from its title and real estate-related operations. Fidelity National Financial, Inc. is currently ranked number 288 on FORTUNE's 2021 list of America's Largest Companies. (Source:Wikipedia)
Latest FNF News From Around the Web
Below are the latest news stories about FIDELITY NATIONAL FINANCIAL INC that investors may wish to consider to help them evaluate FNF as an investment opportunity.
15 Most Affordable Places to Retire on the East CoastIn this article, we are going to explore the 15 most affordable places to retire on the East Coast. If you want to skip our detailed analysis, you may jump directly to the 5 Most Affordable Places to Retire on the East Coast. Why Affordability Matters According to research from Goldman Sachs Asset Management, 75% […] |
16 Best Retirement Communities in Florida Near the BeachIn this article, we are going to explore the 16 best retirement communities in Florida near the beach. If you want to skip our detailed analysis, you can jump directly to 5 Best Retirement Communities in Florida Near the Beach. Retirement Communities in Florida The U.S. Census Bureau notes that the largest percentage of seniors […] |
New Strong Sell Stocks for May 10thBCBP, FNF and MOS have been added to the Zacks Rank #5 (Strong Sell) List on May 10, 2023. |
ServiceLink Survey Reveals Optimism Among Today's Homebuyers Despite Challenging Market ConditionsHigher home prices and low inventory isn't deterring the youngest generations from seeking homeownership. A new survey report from ServiceLink, part of the FNF family of companies and the nation's premier provider of tech-enabled mortgage services, analyzes generational trends among recent homebuyers, their sentiment about today's housing market and the role technology plays throughout the process. |
Fidelity National Financial First Quarter 2023 Earnings: Revenues Beat Expectations, EPS LagsFidelity National Financial ( NYSE:FNF ) First Quarter 2023 Results Key Financial Results Revenue: US$2.47b (down 22... |
FNF Price Returns
1-mo | 4.64% |
3-mo | 2.91% |
6-mo | -1.55% |
1-year | -10.26% |
3-year | 13.26% |
5-year | 13.97% |
YTD | -3.46% |
2022 | -24.65% |
2021 | 38.04% |
2020 | -10.34% |
2019 | 48.75% |
2018 | -17.22% |
FNF Dividends
Ex-Dividend Date | Type | Payout Amount | Change | ||||||
---|---|---|---|---|---|---|---|---|---|
Loading, please wait... |
Continue Researching FNF
Want to see what other sources are saying about Fidelity National Financial Inc's financials and stock price? Try the links below:Fidelity National Financial Inc (FNF) Stock Price | Nasdaq
Fidelity National Financial Inc (FNF) Stock Quote, History and News - Yahoo Finance
Fidelity National Financial Inc (FNF) Stock Price and Basic Information | MarketWatch
Loading social stream, please wait...