- Gold had a rough first quarter in 2021
- The long-term trend remains bullish
- Mining shares offer leverage
- Growth with GDXJ
- Levels to watch in the gold market
Since the turn of this century, the optimal approach to the gold market has been to buy it when it looks like it is about to plunge and sell the precious metal when it seems ready to blast off on the upside. Gold reached a bottom at the $250 level as the United Kingdom parted with half the country’s reserves. In 2011, it peaked at over $1920. In 2020, it made a higher high at $2063 per ounce. At the end of last week, the yellow metal was trading at the $1744.80 level.
Gold has traded in lockstep with the US bond market over the past few months. The $318.20 decline from the August 2020 shaved 15.4% off the price. The 30 Year US Treasury bond futures dropped from 183.06 to below 157 over the same period, a decline of over 14%. Higher interest rates increase the cost of carrying a long gold position.
Bonds compete with gold for investment capital as they offer a yield. Meanwhile, Bitcoin was below the $12,700 level last August when gold reached its latest peak. Gold is over 15% lower, while Bitcoin moved nearly five times higher over the period.
As we head into the second quarter, gold looks weak after its decline from a new all-time high and making lower lows in Q1 2021. Now could be the perfect time to buy gold. If the pattern of the past two decades continues, gold could regain strength after correcting and consolidating. Gold mining shares tend to outperform the yellow metal’s price during rallies.
Junior miners that explore for the precious metal often do even better than the more established producers. The VanEck Junior Gold Miners ETF (GDXJ - Get Rating) holds a portfolio of junior mining companies. Diversification removes the idiosyncratic risks of investing in single mining companies.
Gold had a rough first quarter in 2021
Gold was the worst-performing precious metal during the first quarter of 2021. The yellow metal dropped 9.57%, making it the third-worst performer in the commodity asset class behind frozen concentrated orange juice and cocoa futures.
Gold ended a streak of nine consecutive quarterly from 2018 through 2020 gains in early 2021.
 Source: CQG
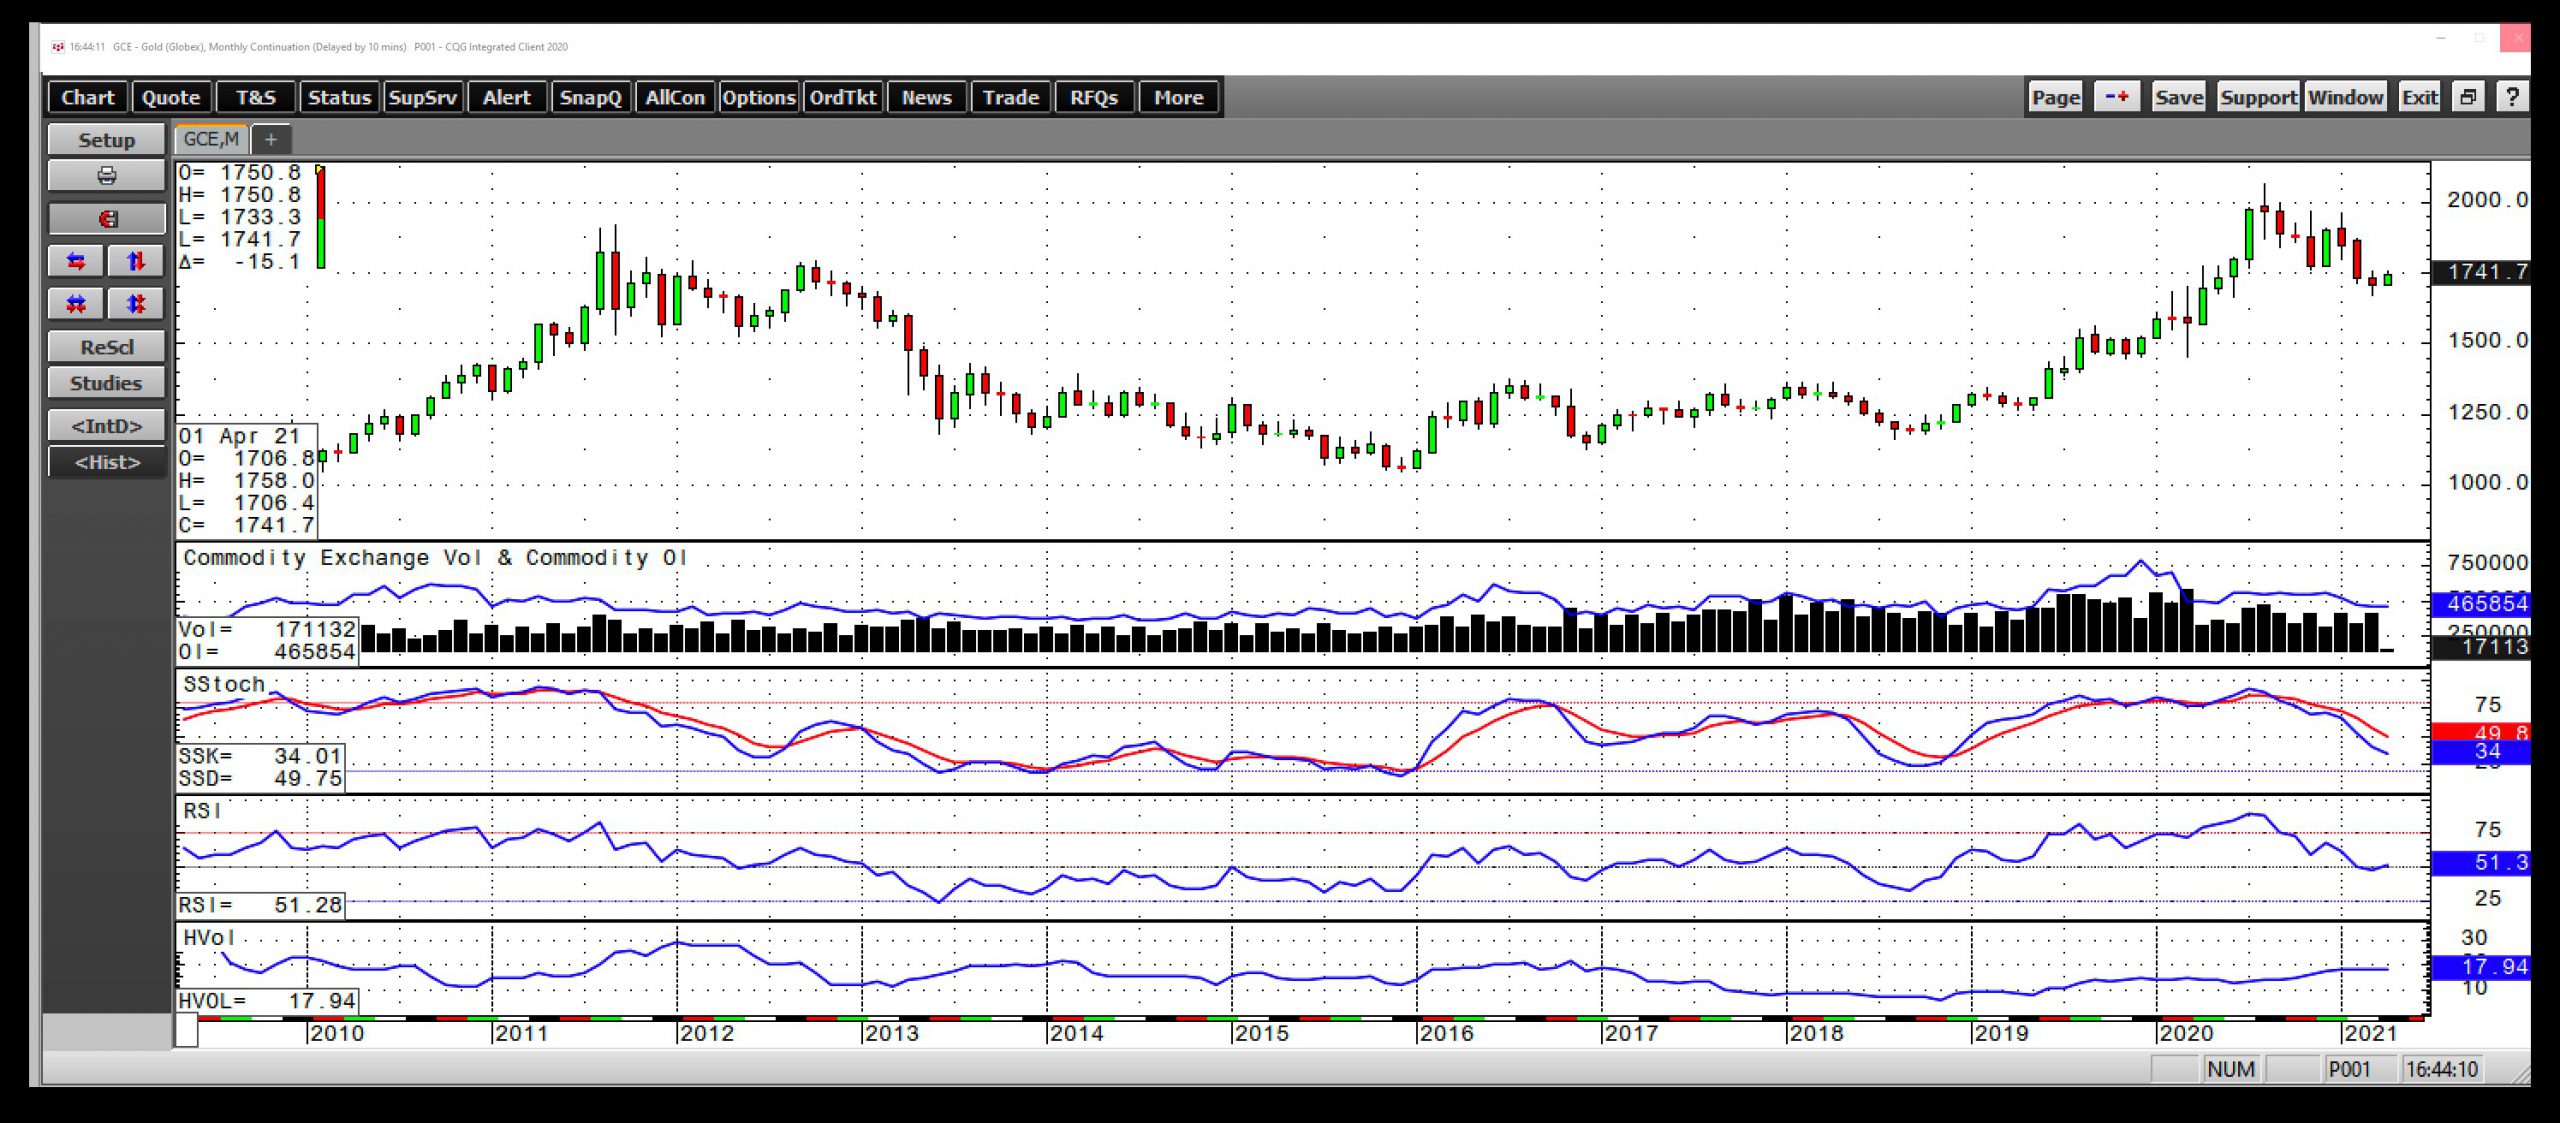
The monthly chart of COMEX gold futures highlights three consecutive months of losses. The total number of open long and short positions in the gold futures arena fell from 560,059 at the end of 2020 to 457,315 contracts on March 31, 2021, dropping 18.3%. Many investors and traders exited long risk positions as the price moved lower throughout the first quarter.
While the relative strength indicator was sitting at a neutral reading at the end of last week, monthly price momentum was falling towards oversold territory. Monthly historical volatility at 17.94% is at the highest level since early 2017. Gold, like most commodities, tends to experience higher volatility levels when the price is falling.
The long-term trend remains bullish
The rise in Bitcoin and other digital currencies and the decline in gold since last August drained almost all bullish sentiment from the gold market. Besides the pack of perennial gold bulls, few market participants are focusing on the yellow metal these days.
The lack of bullish sentiment could be the most supportive factor for the gold market as we head into the second quarter. Since the turn of this century, gold’s price tended to rally when it looked the most bearish and fall when the market became possessed with a bullish frenzy.
 Source: CQG
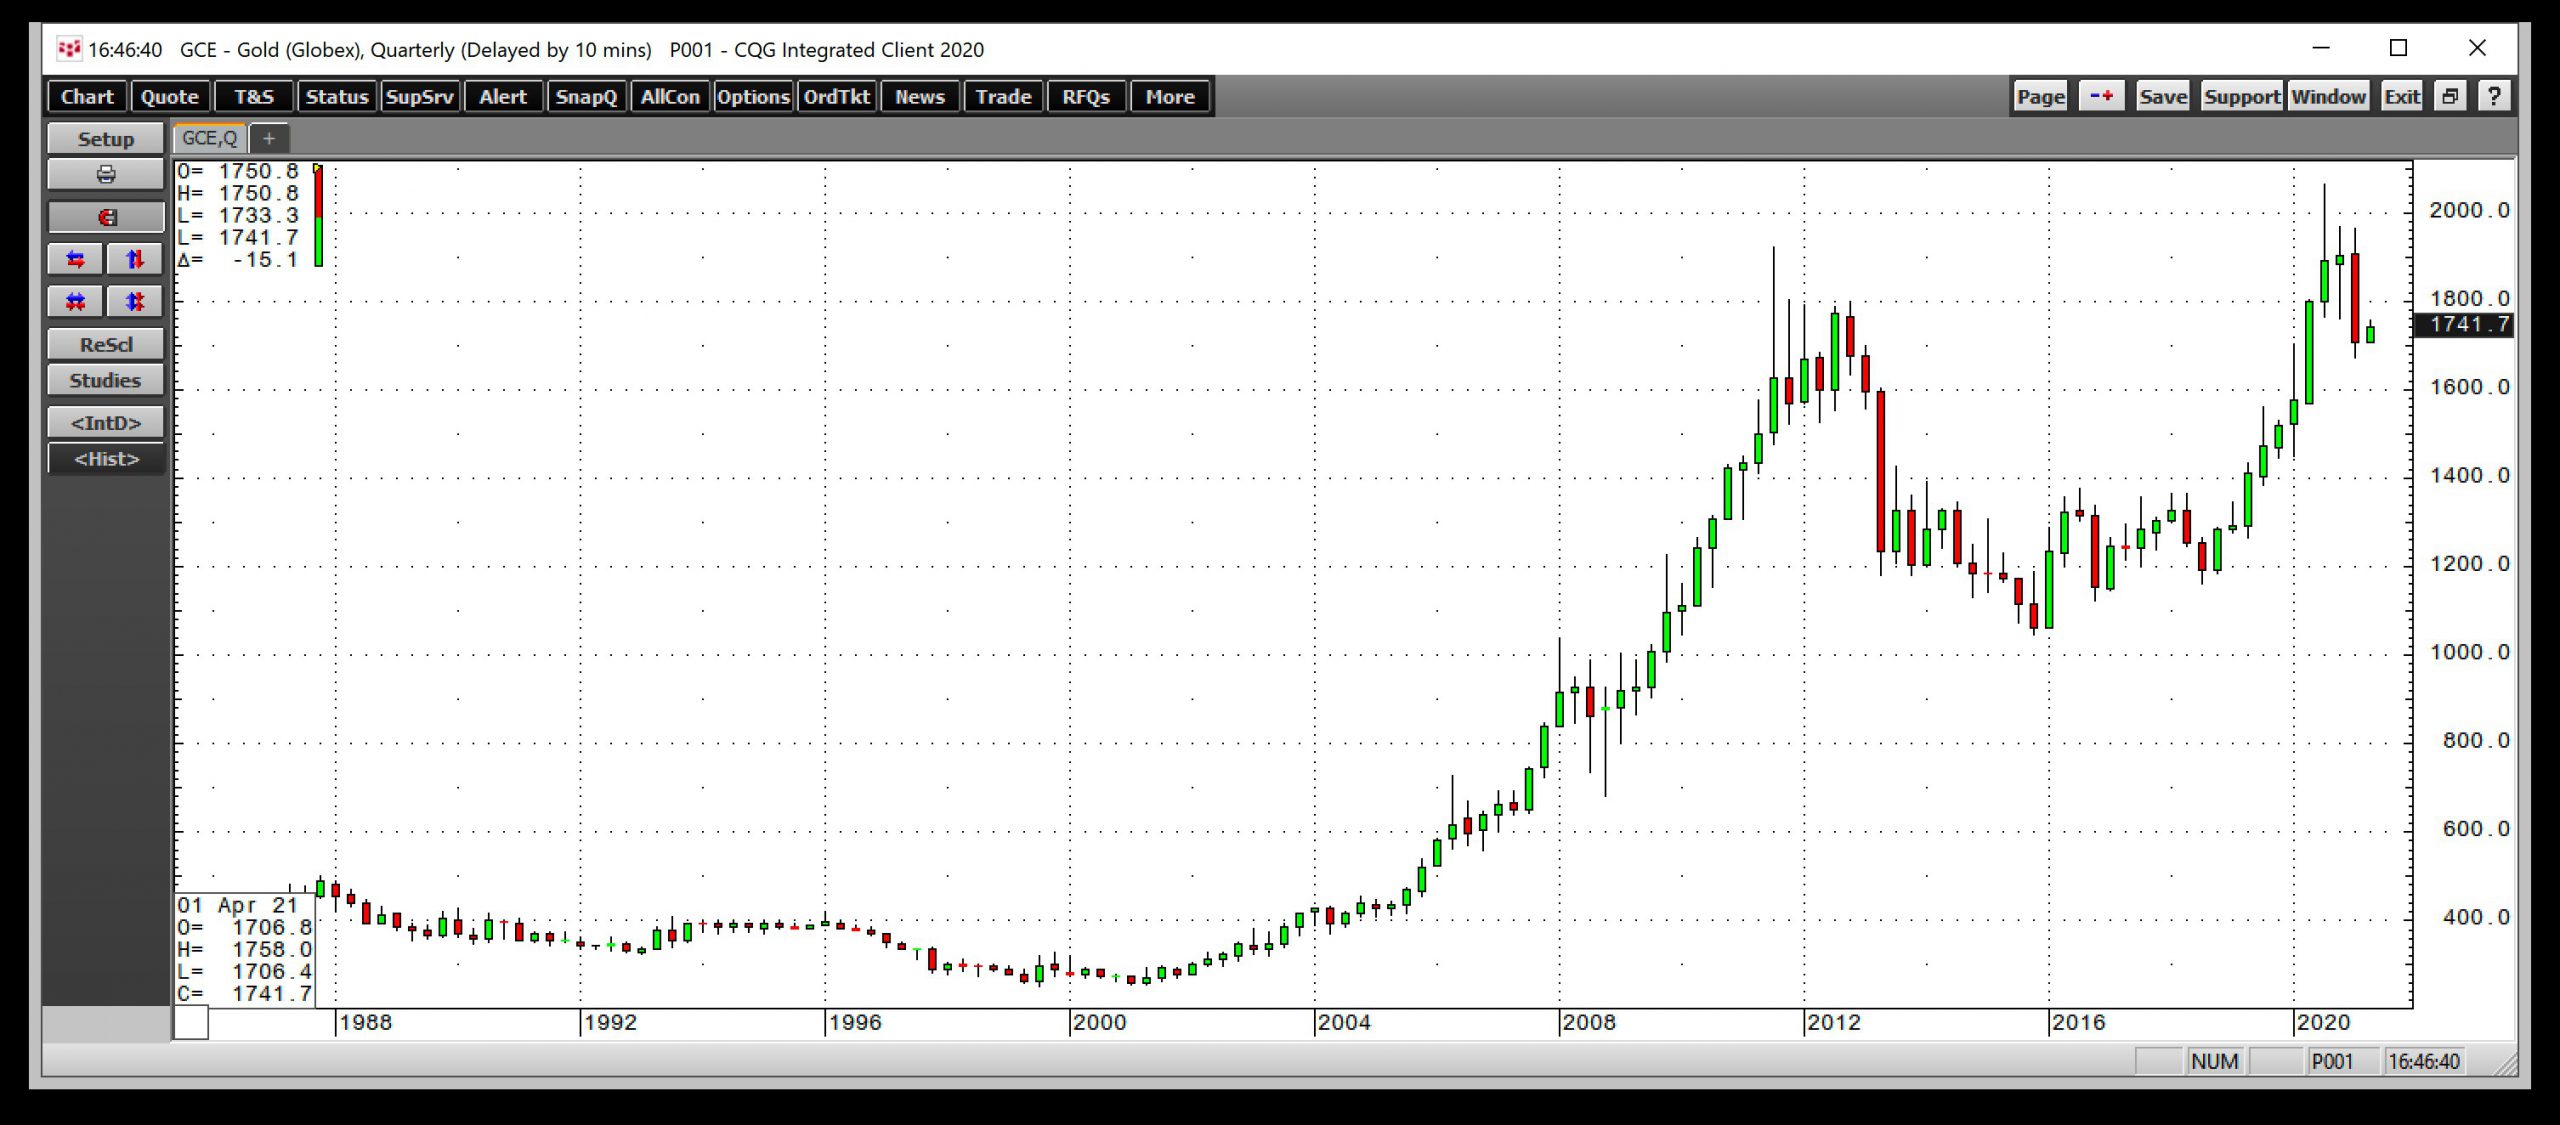
As the quarterly chart illustrates, gold’s bottom came in 1999 at $252.50 per ounce during the United Kingdom’s auction of half its gold reserves. The price hit a marginally higher low of $255 in 2001. Over the past twenty-two years, the precious metal has made higher lows and higher highs, leading to the August 2020 $2063 peak. In 2019 and 2020, gold moved to record highs in virtually all traditional currency terms.
At the $1744.80 level on April 9, the bullish trend remains intact with critical technical support at the $1377.50 level. The support stands at the breakout level from July 2016. In June 2019, gold rose above that high transforming technical resistance to support.
Mining shares offer leverage
Since the turn of this century, anytime gold looked as if it was ready to fall into a bearish abyss, the price rallied to a new high. In 2008, 2011, and 2020, gold reached a series of new all-time highs. Central bank liquidity and government stimulus in response to the global pandemic will leave an inflationary legacy over the coming years.
Gold may be down from the August 2020, but it is far from out as an investment vehicle. Rising inflationary pressures support higher gold prices. While digital currencies have presented a challenge to the yellow metal, governments and central banks are not likely to embrace the burgeoning asset class as reserve assets. After all, Bitcoin and the other nearly 9,200 tokens are a direct threat to their control of the global money supply.
If gold is going to make a comeback, the company’s that extract the yellow metal tend to provide leveraged exposure to the price. The junior mining companies that explore for gold offer more leverage than the senior companies that produce the metal because of the speculative nature of the exploration business.
Growth with GDXJ
Individual mining and exploration companies offer leverage compared to the gold price during bullish periods. However, single companies carry idiosyncratic risks of management and specific mining properties. A portfolio approach mitigates many of these risks.
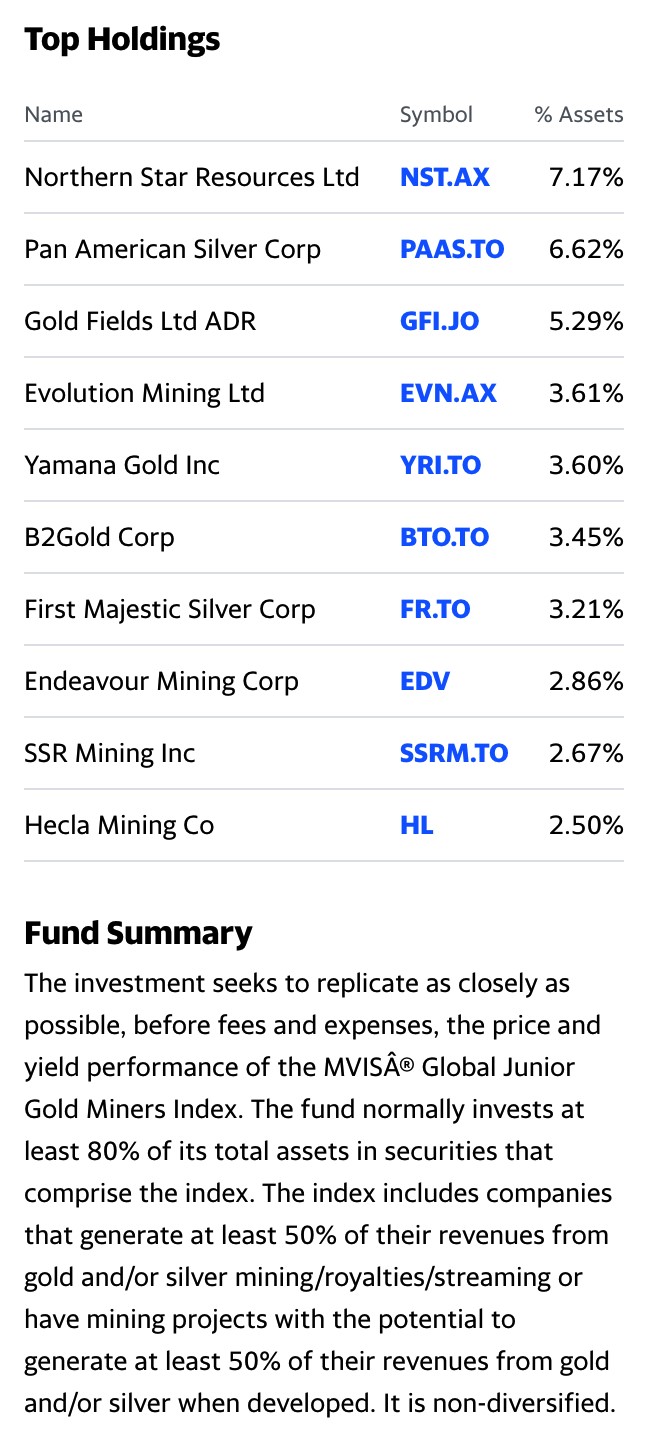
GDXJ is a highly liquid product with $5.14 billion in net assets and an average of over 7.2 million shares changing hands each day. GDXJ charges a 0.53% management fee. The top holdings and fund summary include:
 Source: Yahoo Finance
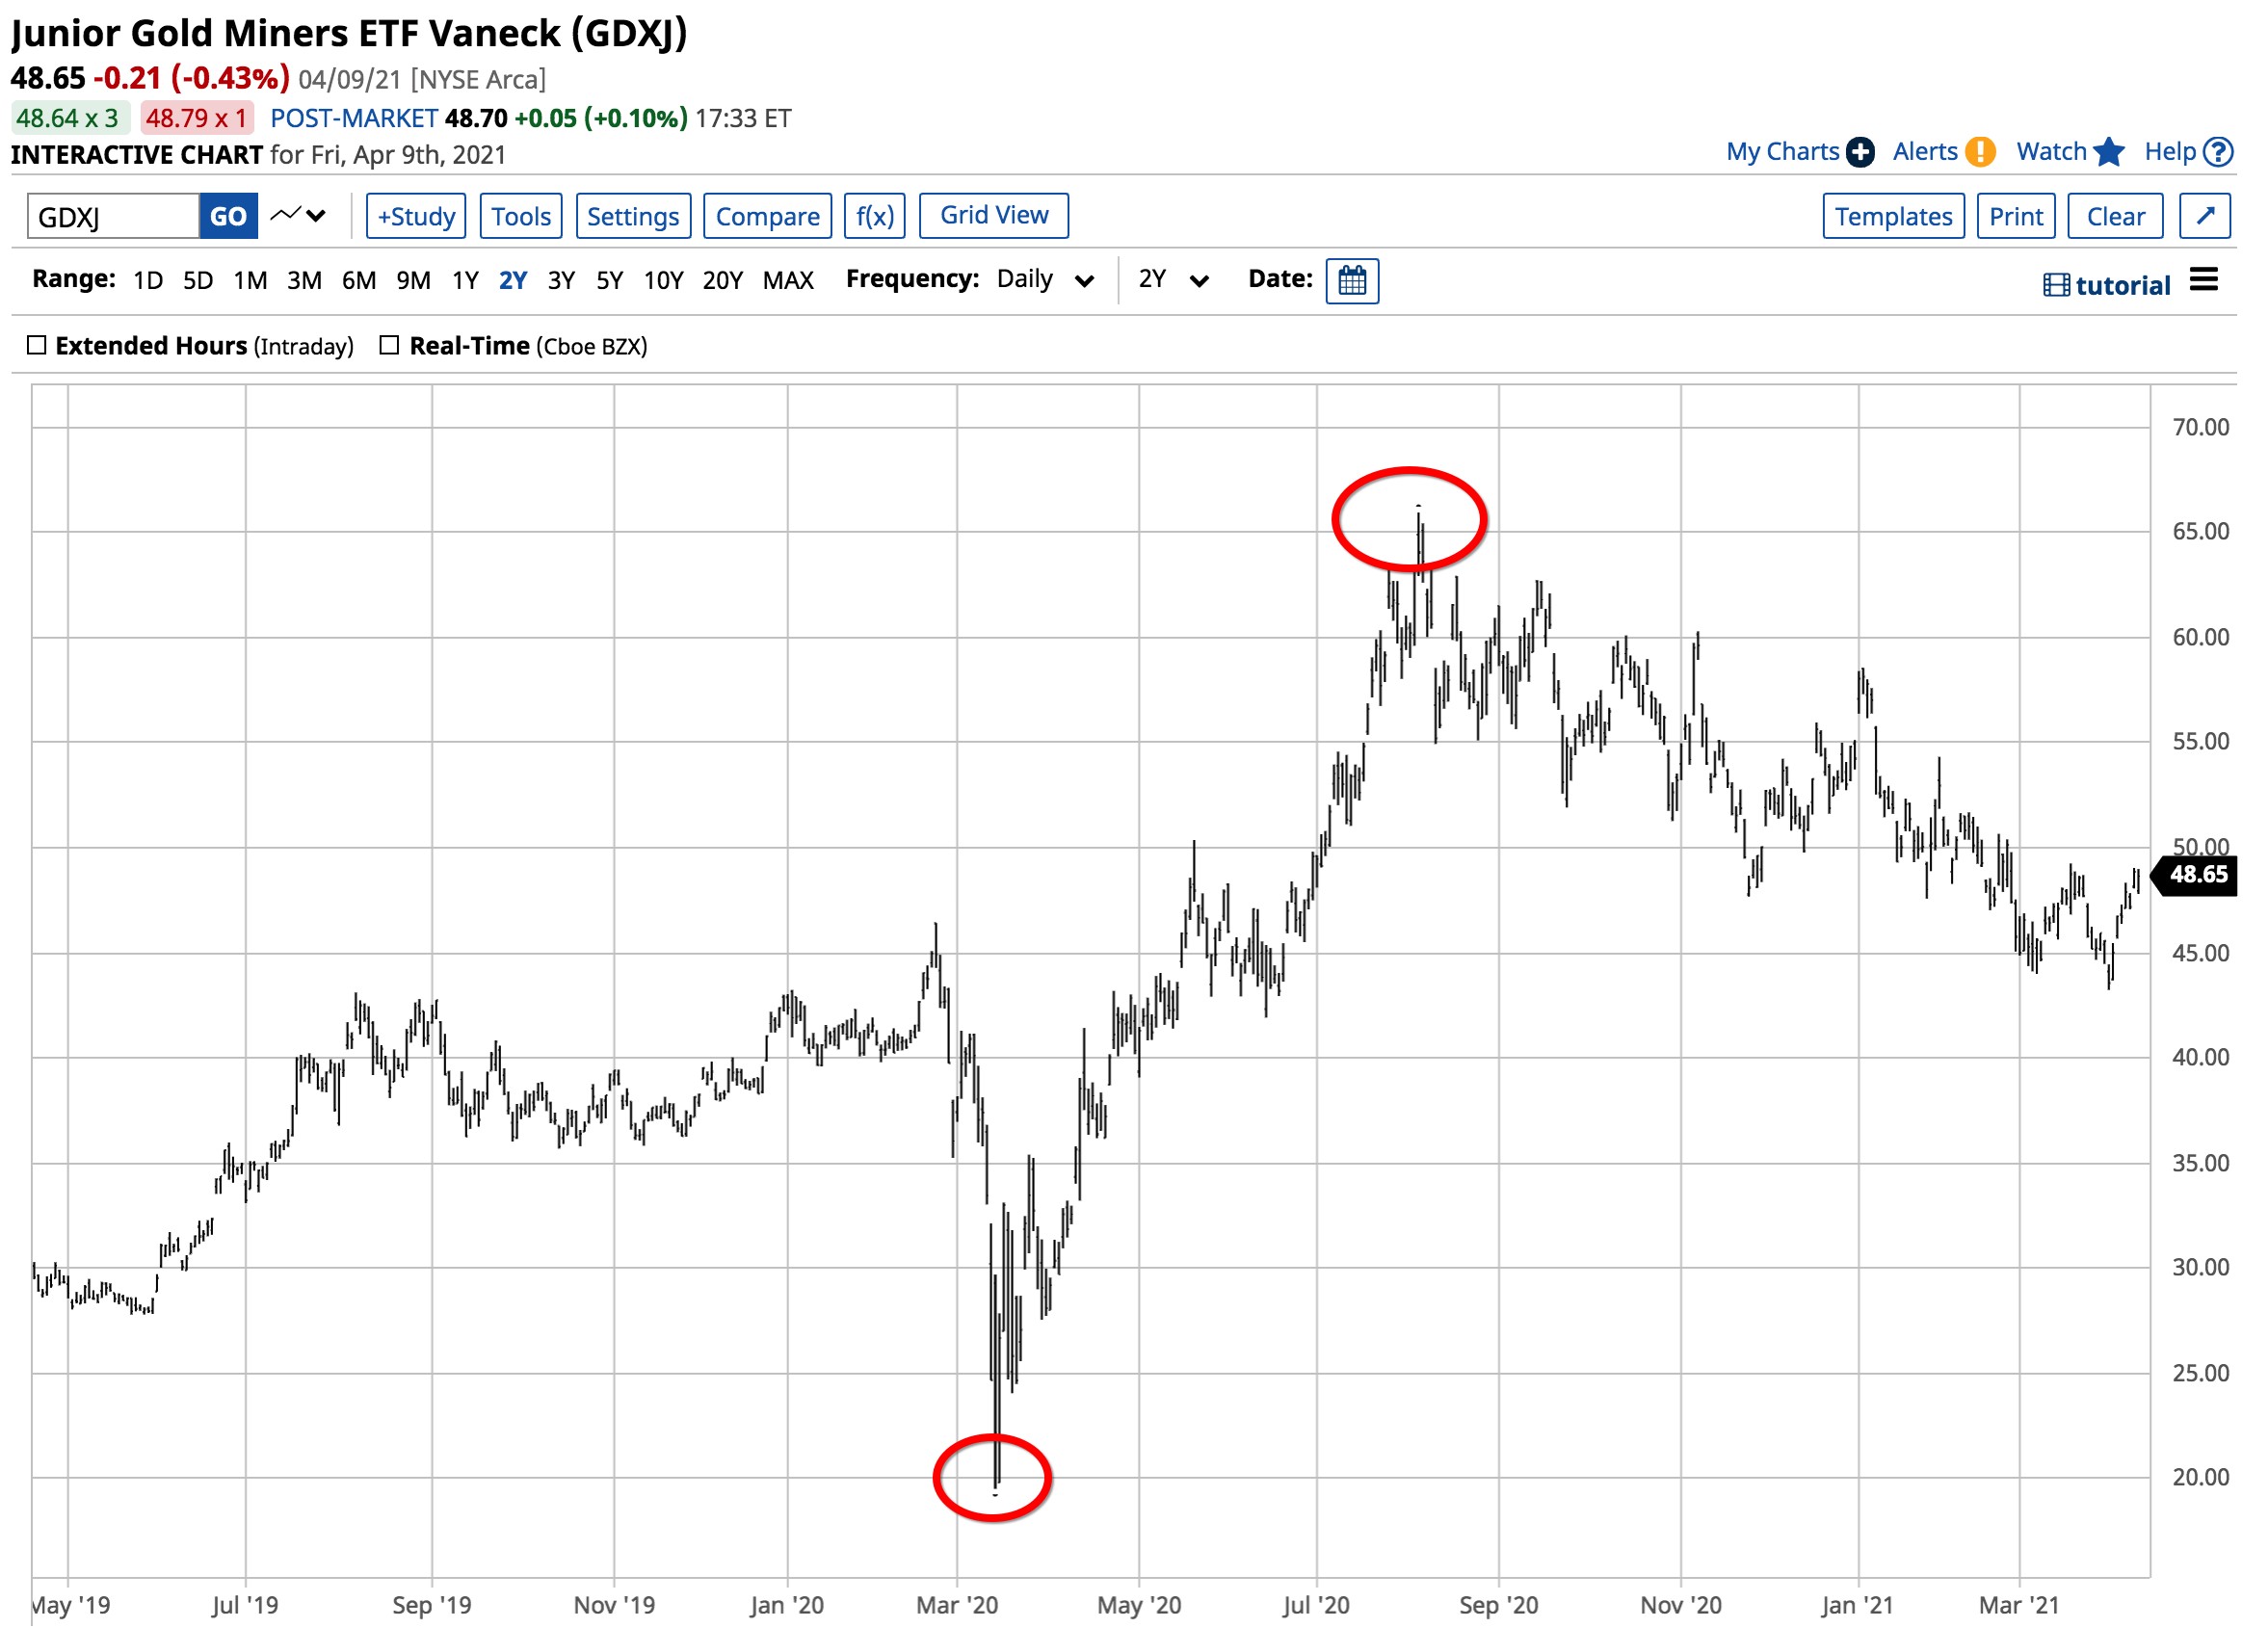
In March 2020, gold futures dropped to $1450.90 per ounce. In August 2020, they peaked at $2063. Gold futures rallied by 42.20% in under five months.
 Source: Barchart
As the chart illustrates, GDXJ rose from $19.52 to $65.95 per share or 237.88% over the same period, over 5.6 times the percentage return in the gold futures arena.
Levels to watch in the gold market
I favor buying gold when the yellow metal is out of favor with the market. For over two decades, fading bearish sentiment in the gold market has led to attractive returns.
 Source: CQG
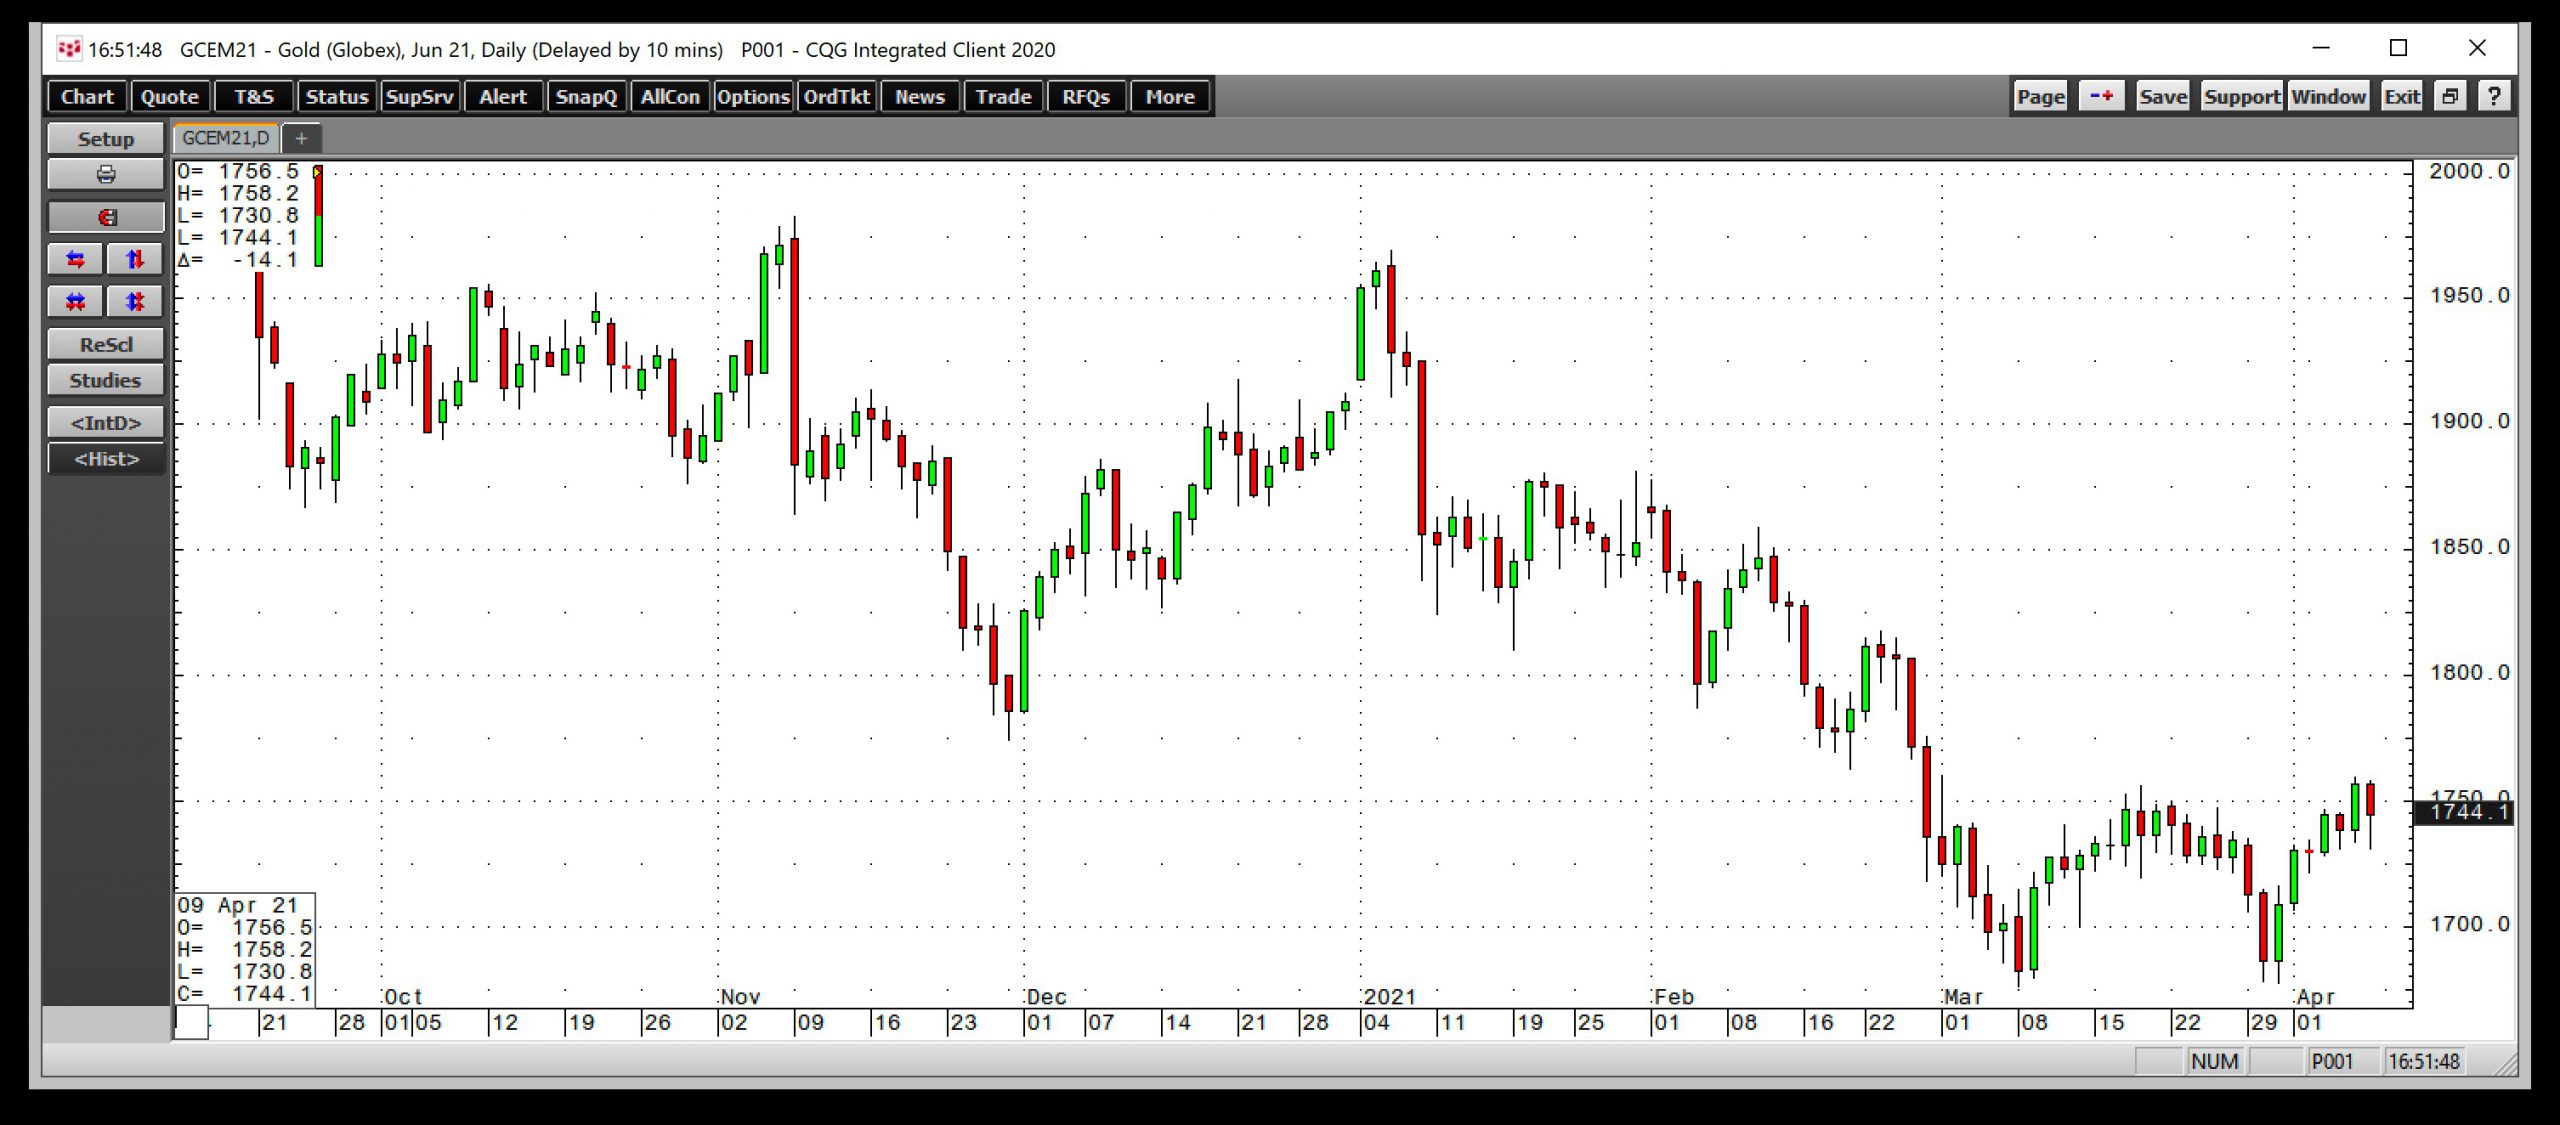
From a short-term perspective, technical support for gold stands at the March 8, 2021, $1676.20 low on the June futures contract. Below there, the $1668.60 continuous contract low from June 2020 and $1450.90 bottom from March 2020 are support levels. The $1377.50 breakout level is the critical price on the downside.
In the June futures contract, The March 18, $1756 high was the first technical resistance level. Last week, the price traded to a high of $1759.40. The next upside target sits at $1876, the late January 2021 high. Above there, $1962.50 was the 2021 peak, and a gateway to the record high at $2063 from last August.
Buying gold on dips since the turn of this century had been the optimal approach. If the trend continues, buying a portfolio of junior gold mining shares via the GDXJ product on a scale-down basis could provide precious returns over the coming months.
Want More Great Investing Ideas?
GDXJ shares rose $0.51 (+1.08%) in premarket trading Tuesday. Year-to-date, GDXJ has declined -11.87%, versus a 10.52% rise in the benchmark S&P 500 index during the same period.
About the Author: Andrew Hecht

Andy spent nearly 35 years on Wall Street and is a sought-after commodity and futures trader, an options expert and analyst. In addition to working with StockNews, he is a top ranked author on Seeking Alpha. Learn more about Andy’s background, along with links to his most recent articles. More...
More Resources for the Stocks in this Article
| Ticker | POWR Rating | Industry Rank | Rank in Industry |
| GDXJ | Get Rating | Get Rating | Get Rating |


