

Global-e Online Ltd. (GLBE - Get Rating) provides e-commerce solutions. It offers a platform to enable and accelerate global, direct-to-consumer cross-border e-commerce. The platform was purpose-built for international shoppers to buy seamlessly online and for merchants to sell from, and to, anywhere in the world.
GLBE is a fairly recent IPO that essentially simplifies cross-border commerce by supporting multiple languages and currencies. In fact, the company has a first-mover advantage in a market with massive opportunity. So far, the firm has shown robust performance as management raised its full-year guidance.
As of the end of the second quarter the company had $488 million in cash, which compares favorably to only $3 million in cash. From a growth standpoint, things look up as analysts expect earnings to jump 185.7% next year.
However, the stock looks overvalued with a high price to sales ratio of 50.8. This is much higher than the industry average of 3.6 and the S&P 500’s 3.2. GLBE has been trending down since September as shown in the chart below.
Take a look at the 6-month chart of GLBE below with my added notations:
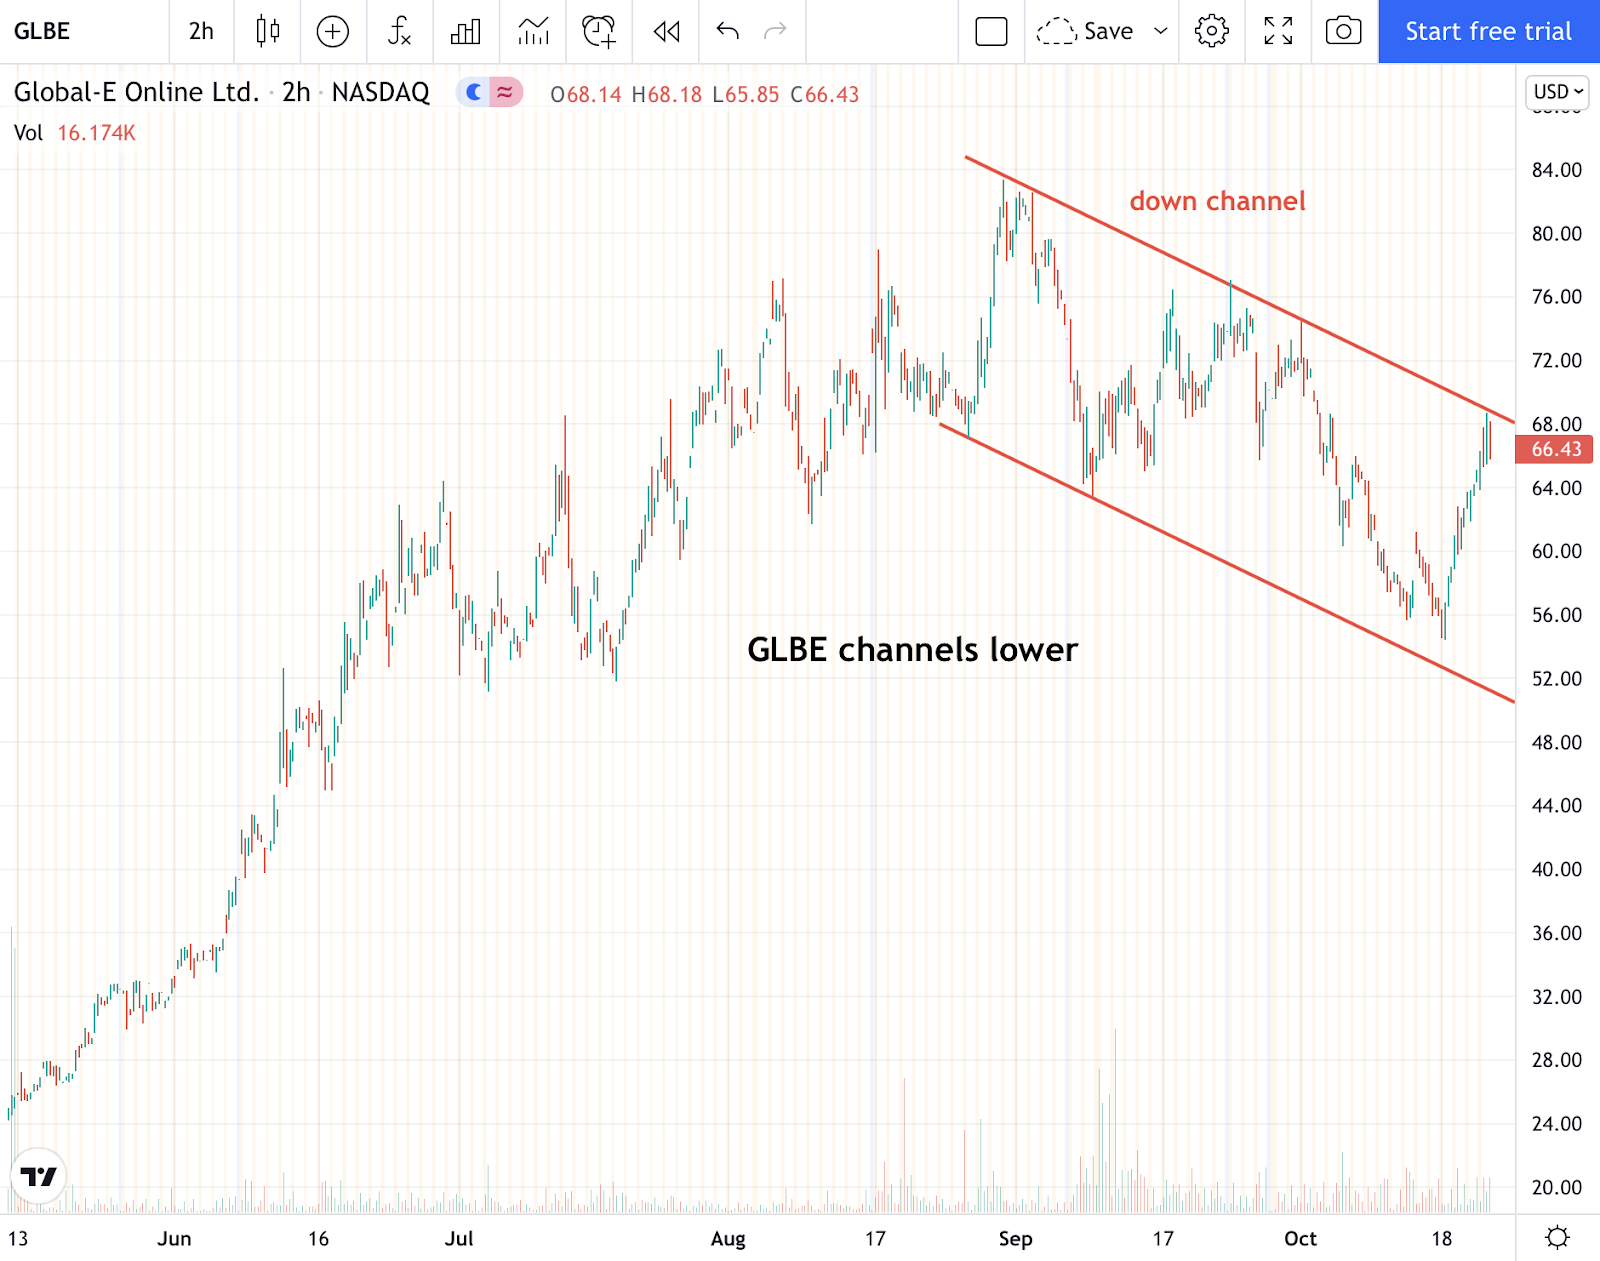
GLBE has formed a down-channel chart pattern over the past two months. A channel is formed through the combination of a trend line support that runs parallel to a trend line resistance. When it comes to channels, any (3) points can start the pattern, but it truly takes a 4th or more to confirm it.
Click Here to Read the Greatest Trading Book Ever Written
A long opportunity in GLBE could be entered on a breakout of the channel resistance. A short trade could be entered if the channel support is broken.
Want to Discover More Great Trades?
What is better than finding the 1 attractive stock in this article?
Discovering 5 timely trades…like the ones in this new special report. Click below to claim your free copy now!
Want More Great Investing Ideas?
GLBE shares were trading at $64.06 per share on Friday morning, down $2.32 (-3.50%). Year-to-date, GLBE has gained 151.22%, versus a 22.65% rise in the benchmark S&P 500 index during the same period.
About the Author: Christian Tharp

I am an expert stock market coach having helped over 4000 beginner and advanced traders & investors from around the world take control of their financial futures. I also write stock market related articles for the Adam Mesh Trading Group and Yolo Publishing. More...
More Resources for the Stocks in this Article
| Ticker | POWR Rating | Industry Rank | Rank in Industry |
| GLBE | Get Rating | Get Rating | Get Rating |


