Global-e Online Ltd. (GLBE): Price and Financial Metrics
GLBE Price/Volume Stats
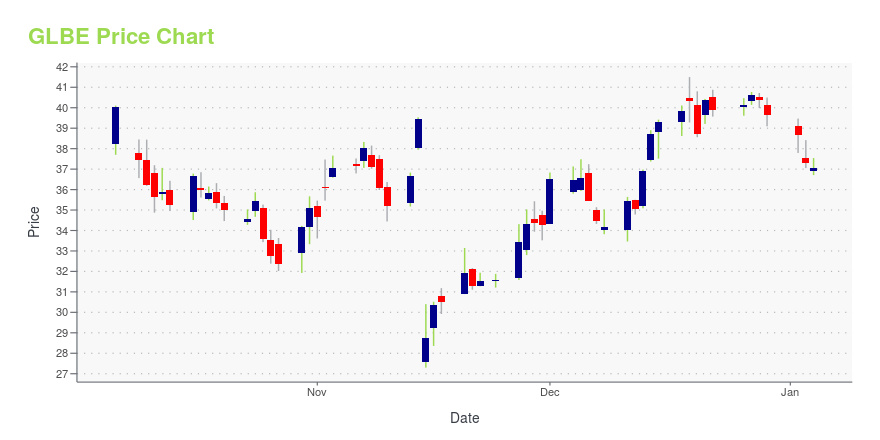
Current price | $39.74 | 52-week high | $45.72 |
Prev. close | $38.84 | 52-week low | $18.14 |
Day low | $39.43 | Volume | 904,700 |
Day high | $40.49 | Avg. volume | 1,302,035 |
50-day MA | $39.44 | Dividend yield | N/A |
200-day MA | $32.70 | Market Cap | 6.53B |
GLBE Stock Price Chart Interactive Chart >
GLBE POWR Grades
- GLBE scores best on the Sentiment dimension, with a Sentiment rank ahead of 83.39% of US stocks.
- The strongest trend for GLBE is in Growth, which has been heading up over the past 178 days.
- GLBE's current lowest rank is in the Value metric (where it is better than 1.68% of US stocks).
GLBE Stock Summary
- GLBE's went public 2.23 years ago, making it older than just 7.22% of listed US stocks we're tracking.
- The price/operating cash flow metric for GLOBAL-E ONLINE LTD is higher than 97.21% of stocks in our set with a positive cash flow.
- With a price/sales ratio of 14.84, GLOBAL-E ONLINE LTD has a higher such ratio than 92.69% of stocks in our set.
- If you're looking for stocks that are quantitatively similar to GLOBAL-E ONLINE LTD, a group of peers worth examining would be ANIK, AZPN, INST, BCOV, and CARG.
- Visit GLBE's SEC page to see the company's official filings. To visit the company's web site, go to www.global-e.com.
GLBE Valuation Summary
- In comparison to the median Consumer Cyclical stock, GLBE's price/sales ratio is 631.71% higher, now standing at 15.
- Over the past 27 months, GLBE's EV/EBIT ratio has gone down 460.4.
Below are key valuation metrics over time for GLBE.
Stock | Date | P/S | P/B | P/E | EV/EBIT |
---|---|---|---|---|---|
GLBE | 2023-08-02 | 15.0 | 7.2 | -36.6 | -36.9 |
GLBE | 2023-08-01 | 16.1 | 7.8 | -39.2 | -39.5 |
GLBE | 2023-07-31 | 16.1 | 7.8 | -39.3 | -39.6 |
GLBE | 2023-07-28 | 15.7 | 7.6 | -38.3 | -38.6 |
GLBE | 2023-07-27 | 15.0 | 7.2 | -36.5 | -36.7 |
GLBE | 2023-07-26 | 15.2 | 7.3 | -37.0 | -37.3 |
GLBE Price Target
For more insight on analysts targets of GLBE, see our GLBE price target page. And for a list of of all stocks sorted by upside potential based on analyst target price, see our Top Price Target page.
Average Price Target | $80.50 | Average Broker Recommendation | 1.43 (Moderate Buy) |
Global-e Online Ltd. (GLBE) Company Bio
Global-e Online Ltd. operates an e-commerce platform that connects online retailers and brands with customers worldwide. The company was incorporated in 2013 and is headquartered in London, United Kingdom. It has additional offices in New York, New York; Paris, France; Petah Tikva, Israel; Beverly Hills, California; Atlanta, Georgia.
Latest GLBE News From Around the Web
Below are the latest news stories about GLOBAL-E ONLINE LTD that investors may wish to consider to help them evaluate GLBE as an investment opportunity.
2 Reasons Global-E Online Is the Stock to Watch NowThe e-commerce industry has been an enormous tailwind that has led to the creation of some of the biggest companies like Amazon, Shopify, and Mercadolibre. It's determined to grab as much market share as possible by signing new companies and brands every quarter, growing its business with existing customers, and partnering with Shopify to accelerate its expansion plan. |
2 Explosive Growth Stocks to Buy in 2023 and BeyondTop-line growth says a lot about the value of its product and its future market opportunity. Two examples of such companies are Monday.com(NASDAQ: MNDY) and Global-E Online (NASDAQ: GLBE). The market for task management software is exploding. |
Are Retail-Wholesale Stocks Lagging Abercrombie & Fitch (ANF) This Year?Here is how Abercrombie & Fitch (ANF) and Global-e Online Ltd. (GLBE) have performed compared to their sector so far this year. |
2 Hypergrowth Tech Stocks to Buy in 2023 and BeyondThough The Trade Desk and Global-e Online are both up more than 80% year to date, these niche dominators still have immense room to grow. |
Prediction: These Could Be the Best Growth Stocks in 2030Part of successful investing is picking stocks with long-term potential, but since that's focused on the future, it's always a bit unknown. A stock's valuation can often seem out of sync with recent performance, but that's because investors are pricing in future potential. Or its valuation may seem absurdly high, but that's because of the company's incredible growth potential. |
GLBE Price Returns
1-mo | -0.65% |
3-mo | N/A |
6-mo | 35.03% |
1-year | 48.51% |
3-year | N/A |
5-year | N/A |
YTD | 92.54% |
2022 | -67.44% |
2021 | N/A |
2020 | N/A |
2019 | N/A |
2018 | N/A |
Loading social stream, please wait...