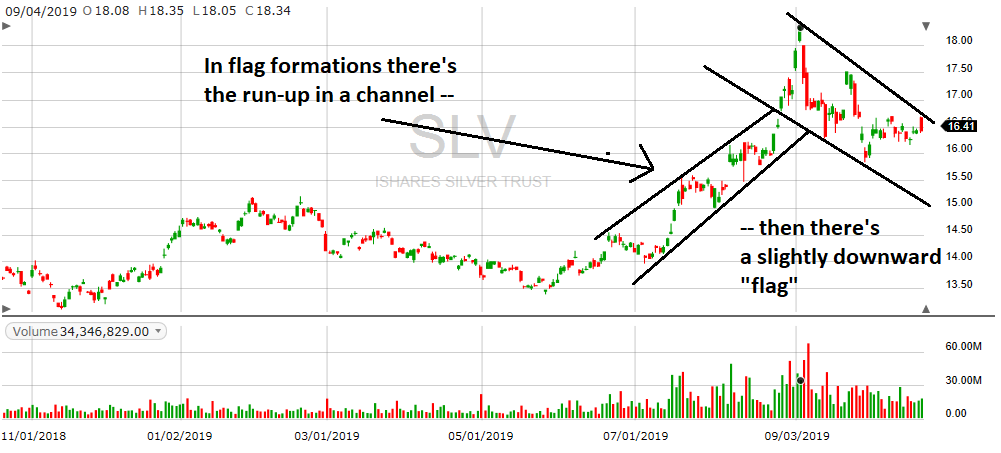
A lot of the talk about silver right now centers around a chart formation called a bull flag. Flags are simple to see, yet many traders don’t trade them well. Let’s take a look. Here’s the chart for SLV for the past year.

(credit Fidelity.com)
In a bullish flag formation you get a run-up in a channel, then a drop-off in another channel. The run-up is important as it sets up the possibility for the flag, and breaks the stock out of the previous trading action.
The trade this pattern signals is the break-out above the flag, aka the downward channel – so, in this case, a break above the 16.50 price for SLV, as of today. The maximum expected return from the trade is the width of the downward channel.
A tight drop-off channel results in a better trade. The width of the flag should be “tight” but not too tight, and the flag needs to be “just long enough to be recognizable”. There aren’t really staandards for these measures, you just have to eyeball them.
What your Gold Enthusiast likes to see is both channels are at least slightly narrower than the usual trading channels for the particular thing being traded. If a channel for a 30-point thing is 10 points wide, that’s almost useless. Yet a 1-point wide channel would give nice clear trading signals. This is, after all, a short-term trading pattern – very few traders watch for bull flags for whole-year or multi-year trades. So we want the trade to pay off relatively quickly, within a few weeks or so.
The problem with the bull flag pattern is after a while the downward flag move should return to the regular action of the stock. Simple waving up and down in a normal sideways pattern is not a series of bull flags. The initial run-up needs to break the stock well above the previous, usually-sideways trading area.
Right now the flag for SLV is long enough, and it’s a bit wide but still OK. If this flag goes on much longer then SLV will probably revert back to it’s normal sideways trading pattern and trading range. Or it could continue down the channel of the flag — that’s the last thing silver bulls want to see.
Signed,
The Gold Enthusiast
DISCLAIMER: The author holds no position in any mentioned security. The author is long the silver sector via small positions in USLV, PAAS and SVBL. He may daytrade around these positions but has no intention of trading out of these core positions in the next 48 hours.
GLD shares were trading at $140.04 per share on Tuesday morning, up $0.25 (+0.18%). Year-to-date, GLD has gained 15.50%, versus a 21.99% rise in the benchmark S&P 500 index during the same period.
About the Author: Mike Hammer
For 30-plus years, Mike Hammer has been an ardent follower, and often-times trader, of gold and silver. With his own money, he began trading in ‘86 and has seen the market at its highest highs and lowest lows, which includes the Black Monday Crash in ‘87, the Crash of ‘08, and the Flash Crash of 2010. Throughout all of this, he’s been on the great side of winning, and sometimes, the hard side of losing. For the past eight years, he’s mentored others about the fine art of trading stocks and ETFs at the Adam Mesh Trading Group More...
More Resources for the Stocks in this Article
| Ticker | POWR Rating | Industry Rank | Rank in Industry |
| GLD | Get Rating | Get Rating | Get Rating |


