
Thanks to the fast-changing soap opera that is the US/China Trade war stocks have spent much of the last year going nowhere fast.
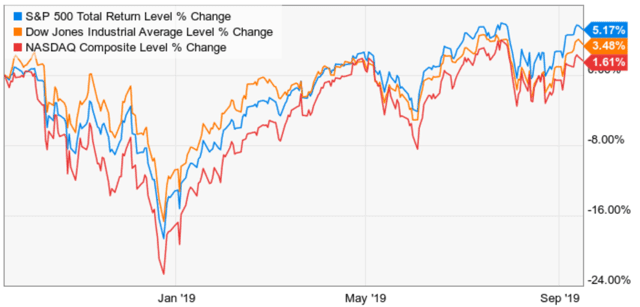
(Source: Ychart)
The tech-heavy (and trade-sensitive) Nasdaq has basically been flat over the past year. The Dow Jones Industrial Average, the oldest US stock index, is up only slightly more. And the S&P 500, a good proxy for large-cap US stocks, while up 5% including dividends, has delivered about half its historical annual return and 1/3 what investors have enjoyed over the past decade.
US Recession risk has soared in recent weeks to a 10 year high, with the bond market estimating a 48% 12-month recession risk, almost all of which can be laid at the feet of the Trade War’s 4th and 5th escalation in August. That led to stocks falling for four straight weeks, and flight to safety Treasury bonds seeing their 4th biggest monthly gains in 46 years.
But as you have probably noticed, September has been far kinder to stock investors. Easing trade war tensions have caused stocks to rally for three straight weeks, to within 0.6% of their all-time high (as of Friday, September 13th).
Investors might be confused by such wild swings in sentiment and share price. So here are the important facts you need to know, about both the goods news and bad news surrounding the trade war, and what’s likely coming next in this real-life economic soap opera.
The Bad News About the Trade War
The market’s sharp crash in sentiment recently, which led to trade-sensitive stocks crashing in August, is largely driven by fear and uncertainty.
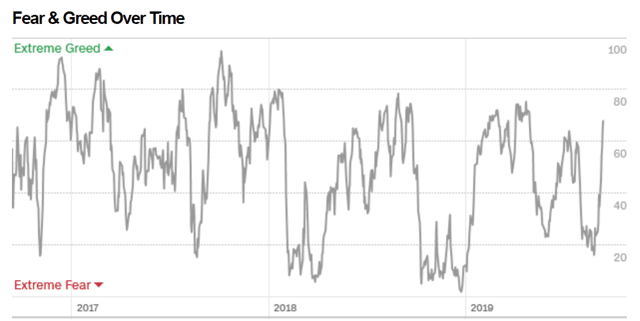
(Source: CNN)
CNN’s Fear and Greed index monitors seven technical indicators (like volatility, junk bond demand and put/call ratios) to provide a single metric for measuring investor sentiment.
Back in late August, it fell to a low of 17, indicating extreme fear. That was due to concerns about a worst-case trade war scenario. What could such a scenario actually look like?
The analysts at Moody’s Analytics have crunched the numbers and according to their proprietary economic model the worst-case full-blown trade war looks like this
- US tariffs on all Chinese imports rise to 30%
- non-trade barriers go up
- US imposes 25% tariffs on EU car parts (about $350 billion worth)
- Congress fails to ratify the USMCA (aka “NAFTA 2.0”) and Trump responds by slapping tariffs on Mexican goods
What are “non-trade barriers”? Here’s Moody’s explaining
These include Chinese bans on U.S. technology exports, voluntary boycotts of U.S. brands, revoked market licenses for U.S. firms, a sharp devaluation of the yuan, and a threat to sell China’s vast holdings of U.S. Treasuries.”
What would be the economic ramifications of this worst-case scenario? One in which President Trump, feeling boxed in by Congress and put upon by enemies on all sides (including a Fed that refuses to cut rates as much as he wants) might decide to become a “trade wartime president” as a 2020 campaign tactic?
The result is a large pullback in investment that, along with price increases and ruffled consumers, causes U.S. and global GDP to contract sharply.
Although the Fed quickly lowers the federal funds rate to the zero lower bound and both major and developing economies adopt monetary stimulus, the blow to global demand overwhelms efforts to ease financial conditions.
The U.S. dollar appreciates as capital flight intensifies and emerging market currencies depreciate sharply. However, external accounts worsen because of the sharp contraction in global trade. All told, real global GDP contracts by 0.3 percent from peak to trough, with deep recessions in the U.S., Europe, and most emerging markets. Growth in China slows substantially and falls just short of recession.” – Moody’s Analystics
That’s sounds scary, especially given that global growth this year is currently expected to be 3.2% according to the IMF (after several reduced outlooks already due to the trade war).
But what exactly does a “deep US recession” look like? In terms of jobs Moody’s estimates the current tariffs have cost us 300,000 total jobs so far (job growth has still been positive, however) and reduced overall GDP by about 0.2% per year. In other words, had this trade war not happened, Moody’s estimates 2019 US GDP growth would be about 2.5%, instead of 2.3%.
Moody’s estimates that, due to how late in the year it is, should things escalate and spin out of control, then
- US GDP growth would be reduced by 0.1% in 2019
- growth reduced 2% in 2020
- growth reduced by 4% in 2021
By the end of 2021, Moody’s estimates that another 500,000 jobs would be lost, and overall US growth that year would be about -2%. BUT before you panic, sell all your stocks and go hide under your bed, keep in mind this is the WORST CASE scenario.
The Good News About the Trade War
First, it should be pointed out that Moody’s definition of a “deep recession” in the US is based on historical context. According to the National Bureau of Economic Research (which declares US recessions), the average contraction since 1945 has lasted 11 months and seen a peak GDP decline of 1.4%.
2% negative growth is bad, but “deep recession” that the media peddles implies that we’re set for a replay of the Great Recession’s 5.1% GDP decline and 5% increase in unemployment (double the historical norm of 2.4% unemployment increase).
Second, Moody’s best estimates of the probabilities of various trade war outcomes show far less cause for concern.
- 50% probability of no trade deal achieved by end of 2020 (currently scheduled tariffs go up but no escalation beyond that)
- 35% probability of escalation to the worst-case scenario
- 15% probability of an interim agreement being reached, in which no new tariffs go up and some may (or may not) be reduced – things don’t get worst relative to September 1st
Or to put another way, Moody’s thinks there are basically 2:1 odds that we avoid disaster, in which “disaster” means a slightly worse than average recession that will likely only last as long as the trade war does.
And I should point out that Moody’s estimates came out before Bloomberg reported that Trump is now considering taking an interim deal that
- avoids the additional 5% tariffs on $250 billion in Chinese imports on October 15th
- avoids the 15% tariffs on $180 billion in electronics set for December 15th
- possibly rolls back the most recent 15% tariffs on $110 billion in mostly apparel that went up on September 15th
- sees China agree to stronger IP protections (they’ve been improving that since last year anyway)
- buys more US energy and agricultural goods (red-state farmers have been gutted by the trade war)
Trump’s postponement of the 5% tariff hike scheduled for October 1st to October 15th, as a goodwill gesture to celebrate China’s 70th founding anniversary, was reciprocated by China announcing that soybeans and other agricultural goods won’t be on the list of new 5% to 10% tariffed goods (retaliation on the September 1st tariffs).
I’d estimate that the 15% probability of an interim deal, possibly coming as early as October, is now 20% to 25% thanks to this de-escalation. That’s still not the base case, which remains no deal next year.
But the point is that the current strength of the US economy is sufficient to likely turn a base case “no trade deal” into slower 2020 growth but no recession.
What It Means for Your Portfolio
Since 1945 we’ve had just two non-recessionary bear markets. Does that mean that if we avoid recession in 2020 that there is zero chance we don’t get a bear market? There are no guarantees on Wall Street. But the probability of a bear market becomes much lower, and that’s what investors are REALLY scared of.
What about correction and pullback (5% to 9.9% decline) risk? Since 1945 we’ve averaged a 5% to 19.9% decline from record highs every six months, including during the past decade.
Pullbacks and corrections can occur at any time for any reason, (mostly overblown reactions to bad news). The S&P 500 is currently trading at 17.3 to 17.5 forward earnings, depending on what estimates you use. Those estimates have been drifting lower all year and are likely to continue to do so barring a breakthrough at the October trade talks (20% to 25% probability event).
That means that we’re likely to see another pullback within a few months, simply due to the market being about 8% historically overvalued (16.2 is the 25-year average forward PE).
So does that mean today is a terrible time to be buying stocks? Depends on what kind of investor you are. As my fellow Dividend King and F.A.S.T Graphs founder, Chuck Carnevale, says “it’s a market of stocks, not a stock market.”
While the broader market may be getting frothy, there are always great bargains to be found on Wall Street. For example, Altria (MO) is currently trading at a safe 8.1% yield, a yield it’s only offered about 3% of the time over the past 25 years.
The company’s previous peak yields were
- 8% (March 2009)
- 10% (April 2000, the bottom of the value bear market created by the tech bubble and ongoing fears about the 1998 $206 billion master tobacco settlement)
Could Altria go even lower, driven by a perfect storm of scary headlines about vaping and uncertainty about the proposed $200 billion PM/MO merger? Sure.
But I’ve been buying hand over fist, now 11 times in all, because the company’s fundamentals remain sound, its dividend safe and growing (it’s a dividend king with 50 straight years of payout hikes to its name), and there has never been a time when long-term income investors have regretted buying Altria at an 8% yield.
Could this time be different? Sure. Oak Tree Capital founder Howard Marks said that “20% of the time this time really is different.” But that’s why risk management is important. I’m personally willing to risk up to 12% of my portfolio in Altria IF the market were to become bearish enough, for long enough, and allow me to build up a big enough position (tobacco itself is capped at 16% of my portfolio).
Today MO is 5% of my portfolio, with plenty of room to add more should the negativity continue to get worse. But with the merger talks now largely completed, according to CNBC. Any day now news that PM is buying MO for 0.718 PM shares per Altria share, the level that keeps Altria’s dividend streak intact and transfers its dividend king status to Philip Morris, could send Altria shares soaring 20% to 25% in a single day.
Mind you I don’t care about a potential one day 25% gain, as much as I do about the $1,344 my 400 shares are paying me. But the point is that while the market may be getting a bit too euphoric about trade talks next month (and is likely to be disappointed) I’m focused like a laser on maximizing my long-term safe income by
- buying above average quality dividend stocks
- that are growing as fast or faster than the S&P 500’s historical 6.5% (MO is growing at 8%, PM 8-9%, combined 9% to 10%)
- at great valuations (MO’s PE is 10.2, lower than S&P 500’s March 9th, 2009 low of 10.3)
- and then holding for the long-term, waiting for the market to finally value this company at reasonable levels (historical PE over the past 10 years is 16.4 and during bubbles, it’s traded as high as 24.3)
About the Author: Adam Galas

Adam has spent years as a writer for The Motley Fool, Simply Safe Dividends, Seeking Alpha, and Dividend Sensei. His goal is to help people learn how to harness the power of dividend growth investing. Learn more about Adam’s background, along with links to his most recent articles. More...
More Resources for the Stocks in this Article
| Ticker | POWR Rating | Industry Rank | Rank in Industry |
| .INX | Get Rating | Get Rating | Get Rating |


