

Lululemon Athletica Inc. (LULU - Get Rating) designs, distributes, and markets athletic apparel and accessories for women, men, and girls. The company has been experiencing a boost in ecommerce sales as customers continue purchasing from home. The company is also expanding into home-fitness with its recent purchase of home fitness company Mirror.
Mirror has an interactive workout platform that features live fitness classes and on-demand workouts. LULU expects to add its own classes to the platform. As gyms remain closed, this addition should help LULU weather the pandemic.
LULU, unlike other retail companies, doesn’t partner with physical storefronts, so it wasn’t as exposed to the physical store closings during the lockdown. LULU also generates a lot of its revenue online, which should lead to continued growth for the company during COVID and after. Their estimated sales growth for next year is 25%.
The Tale of the Tape
Take a look at the 1-year chart of Lululemon below with the added notations:
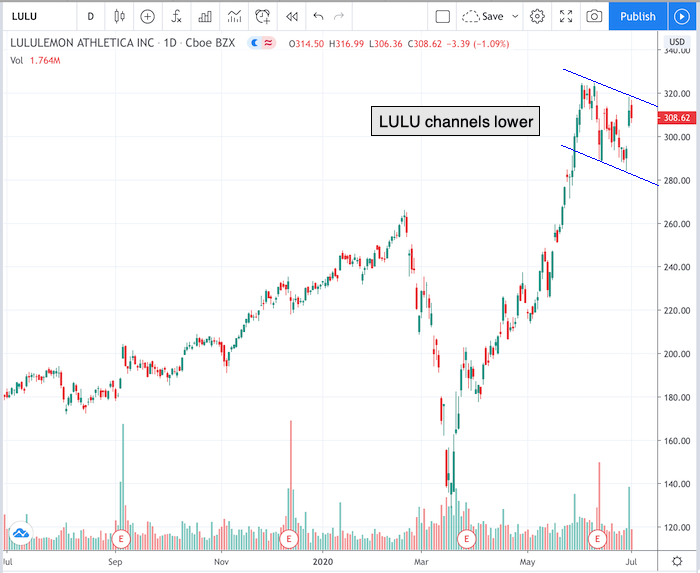
Chart of LULU provided by TradingView
After hitting repeated new highs a few weeks ago, LULU appears to be in a “flag.”
In technical analysis, a flag is a pattern in which we see a sharp rise in the price of a stock, followed by some sideways consolidation (looks like a flag). In LULU’s chart above, you can see the stock rallied in May, and since then has formed a sideways “channel.”
This is a bullish pattern and LULU could be setting up for another leg higher, if it is able to break above the $315 area (flag resistance line).
Before making any trading decision, decide which side of the trade you believe gives you the highest probability of success. Do you prefer the short side of the market, long side, or do you want to be in the market at all? If you haven’t thought about it, review the overall indices themselves. For example, take a look at the S&P 500. Is it trending higher or lower? Has it recently broken through a key resistance or support level? Making these decisions ahead of time will help you decide which side of the trade you believe gives you the best opportunities.
No matter what your strategy or when you decide to enter, always remember to use protective stops and you’ll be around for the next trade. Capital preservation is always key!
Good luck!
Christian Tharp, CMT
Follow me on Twitter: @cmtstockcoach
Stock Trading & Investing for Everyone
Want More Great Investing Ideas?
9 “BUY THE DIP” Growth Stocks for 2020
Is the Bull S#*t Rally FINALLY Over?
7 “Safe-Haven” Dividend Stocks for Turbulent Times
Top 3 Investing Strategies for 2020
LULU shares were trading at $310.03 per share on Thursday morning, up $1.41 (+0.46%). Year-to-date, LULU has gained 33.82%, versus a -1.30% rise in the benchmark S&P 500 index during the same period.
About the Author: christian

Christian is an expert stock market coach at the Adam Mesh Trading Group who has mentored more than 4,000 traders and investors. He is a professional technical analyst that is a certified Chartered Market Technician (CMT), which is a designation awarded by the CMT Association. Christian is also the author of the daily online newsletter Todays Big Stock. More...
More Resources for the Stocks in this Article
| Ticker | POWR Rating | Industry Rank | Rank in Industry |
| LULU | Get Rating | Get Rating | Get Rating |


