lululemon athletica inc. (LULU): Price and Financial Metrics

lululemon athletica inc. (LULU): $365.44

37.09 (+11.30%)

POWR Rating

Component Grades

Momentum

D

Stability

D

Sentiment

Quality

B

Add LULU to Watchlist
Sign Up

Industry: Fashion & Luxury

Industry

B

Ranked

#33 of 66

in industry

LULU Price/Volume Stats

Current price $365.44 52-week high $389.06
Prev. close $328.35 52-week low $258.79
Day low $364.82 Volume 9,317,200
Day high $386.33 Avg. volume 1,874,750
50-day MA $363.38 Dividend yield N/A
200-day MA $331.04 Market Cap 46.47B

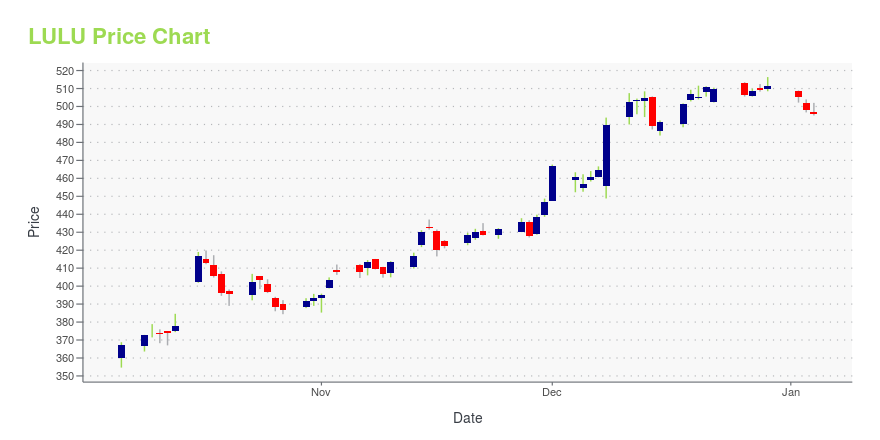
LULU Stock Price Chart Interactive Chart >

LULU POWR Grades

  • Quality is the dimension where LULU ranks best; there it ranks ahead of 96.37% of US stocks.
  • The strongest trend for LULU is in Quality, which has been heading up over the past 179 days.
  • LULU's current lowest rank is in the Value metric (where it is better than 7.57% of US stocks).

LULU Stock Summary

  • LULULEMON ATHLETICA INC's market capitalization of $42,055,534,154 is ahead of 94.78% of US-listed equities.
  • With a price/earnings ratio of 49.2, LULULEMON ATHLETICA INC P/E ratio is greater than that of about 87.89% of stocks in our set with positive earnings.
  • The price/operating cash flow metric for LULULEMON ATHLETICA INC is higher than 90.96% of stocks in our set with a positive cash flow.
  • Stocks that are quantitatively similar to LULU, based on their financial statements, market capitalization, and price volatility, are BFS, IDXX, VINP, ABUS, and SFM.
  • LULU's SEC filings can be seen here. And to visit LULULEMON ATHLETICA INC's official web site, go to www.lululemon.com.

LULU Valuation Summary

  • LULU's EV/EBIT ratio is 33.7; this is 143.32% higher than that of the median Consumer Cyclical stock.
  • Over the past 192 months, LULU's price/sales ratio has gone down 2.4.

Below are key valuation metrics over time for LULU.

Stock Date P/S P/B P/E EV/EBIT
LULU 2023-05-19 5.5 14.3 52.6 33.7
LULU 2023-05-18 5.7 14.7 54.1 34.6
LULU 2023-05-17 5.6 14.4 53.1 34.0
LULU 2023-05-16 5.6 14.4 53.0 34.0
LULU 2023-05-15 5.7 14.6 53.6 34.3
LULU 2023-05-12 5.7 14.6 53.7 34.4

LULU Growth Metrics

    The 4 year net cashflow from operations growth rate now stands at 67.46%.
  • The 4 year revenue growth rate now stands at 62.46%.
  • The 5 year revenue growth rate now stands at 62.46%.
Over the past 49 months, LULU's revenue has gone up $4,418,130,000.

The table below shows LULU's growth in key financial areas (numbers in millions of US dollars).

Date Revenue Operating Cash Flow Net Income to Common Stock
2022-09-30 7,467.793 651.183 1,169.493
2022-06-30 7,061.325 743.718 1,101.811
2022-03-31 6,643.615 931.743 1,020.364
2021-12-31 6,256.617 1,389.108 975.322
2021-09-30 5,857.053 1,376.056 870.655
2021-06-30 5,524.058 1,243.046 826.51

LULU's Quality Factors

The “Quality” component of the POWR Ratings focuses on 31 different factors of a companies fundamentals and operational strength. Here are some key insights as we drill into the specifics of these quality attributes.
  • LULU has a Quality Grade of A, ranking ahead of 97.78% of graded US stocks.
  • LULU's asset turnover comes in at 1.335 -- ranking 6th of 32 Apparel stocks.
  • DECK, TPR, and PVH are the stocks whose asset turnover ratios are most correlated with LULU.

The table below shows LULU's key quality metrics over time.

Period Asset Turnover Gross Margin ROIC
2021-08-01 1.335 0.576 0.445
2021-05-02 1.273 0.569 0.383
2021-01-31 1.214 0.560 0.320
2020-11-01 1.197 0.556 0.312
2020-08-02 1.206 0.553 0.312
2020-05-03 1.279 0.555 0.342

LULU Price Target

For more insight on analysts targets of LULU, see our LULU price target page. And for a list of of all stocks sorted by upside potential based on analyst target price, see our Top Price Target page.

Average Price Target $448.29 Average Broker Recommendation 1.53 (Moderate Buy)

lululemon athletica inc. (LULU) Company Bio


Lululemon Athletica designs, manufactures, and distributes athletic apparel and accessories for women, men, and female youth. It operates through two segments, corporate-owned stores and direct-to-consumer. The company was founded in 1998 and is based in Vancouver, Canada.


LULU Latest News Stream


Event/Time News Detail
Loading, please wait...

LULU Latest Social Stream


Loading social stream, please wait...

View Full LULU Social Stream

Latest LULU News From Around the Web

Below are the latest news stories about LULULEMON ATHLETICA INC that investors may wish to consider to help them evaluate LULU as an investment opportunity.

3 Major Retail Stocks to Buy After Beating Earnings Expectations

Overall, the retail sector continues to struggle.

Bret Kenwell on InvestorPlace | May 22, 2023

From Yoga Pants to Putters: LogicSource Helps Companies Slash Procurement Costs

LogicSource helps retail, CPG, restaurant and consumer companies find efficiencies and cost savings Clients include Lululemon Athletica Inc., Tractor Supply Company, Rite Aid Corp., Société BIC SA (commonly known as BiC), WellSpan Health, Acushnet Holdings Corp.’s Titleist Five years of profitability and 170% expected three-year revenue growth rate through 2023 Indirect expenses (marketing, packaging, IT, […]

Yahoo | May 22, 2023

Lululemon: Buy, Sell, or Hold?

There's no question that Lululemon Athletica (NASDAQ: LULU) has been a fantastic investment to own over the years. While many companies continue to struggle with the uncertain economic environment, particularly as it relates to high inflation, rising interest rates, and the threat of a recession, Lululemon's business has benefited from strong momentum.

Yahoo | May 20, 2023

PVH or LULU: Which Is the Better Value Stock Right Now?

PVH vs. LULU: Which Stock Is the Better Value Option?

Yahoo | May 19, 2023

2 Stocks That Could Create Lasting Generational Wealth

A sudden drop in stock prices can make investors nervous about putting money to work in the stock market. Stocks can fall unexpectedly, but the best growth stocks rise much higher than they fall over time. If you have some extra cash to invest, here are two growth stocks that could deliver outstanding returns for decades to come.

Yahoo | May 19, 2023

Read More 'LULU' Stories Here

LULU Price Returns

1-mo -4.35%
3-mo 15.34%
6-mo -4.12%
1-year 21.49%
3-year 12.88%
5-year 192.40%
YTD 14.06%
2022 -18.16%
2021 12.48%
2020 50.23%
2019 90.50%
2018 54.74%

Get Free Updates

Join thousands of investors who get the latest news, insights and top rated picks from StockNews.com!