Microsoft stock (MSFT) was impervious to the late week selling that saw fellow 3 trillion-dollar market cap club members Apple (AAPL) and Nvidia (NVDA) have a down week. Both AAPL and NVDA closed well off the recent record closing highs while MSFT once again closed at a fresh new high.
Indeed, Microsoft stock has now firmly retaken the number one position at $3.34 trillion with AAPL at $3.18 trillion and NVDA at a $3.11 trillion.
On the surface, all appears rosy for the red-hot rally in MSFT stock to continue.
Beneath the surface, however, there are several warnings signs that caution may be warranted.
Valuations
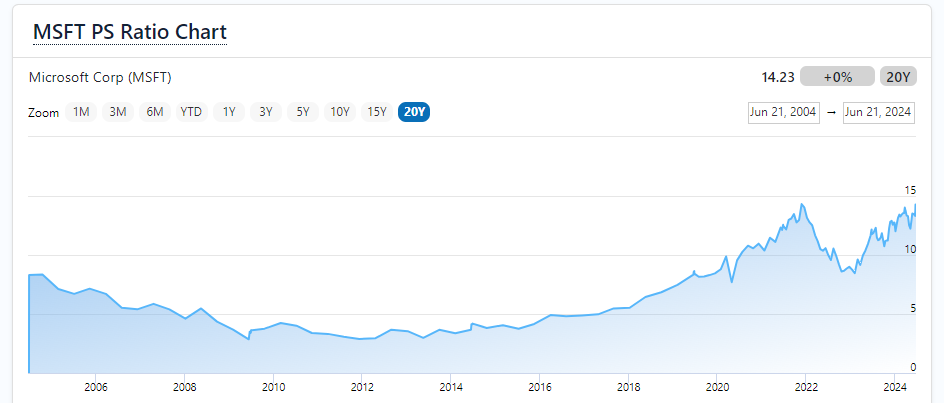
Microsoft is back at over a 14x Price/Sales ratio. The only previous time this occurred was in December 2021 which marked a significant top in MSFT stock.
Plus, having a 14x multiple on a mega-cap $3 trillion stock is somewhat hard to justify given growth rates become exceedingly more difficult to expand simply due to the law of large numbers.
Important to remember that interest rates were dramatically lower back in late 2021. Fed Funds stood at 0.00-0.25% while the 10-year Treasury yield was near 1.5% back then.
Compare that to a current Fed Funds rate of 5.25-5.5% and 10-year yield of 4.25%. Normally such sharply higher rates would compress valuation multiples to a large degree. Especially given that the Fed recently signaled only one rate cut for 2024.
No doubt Microsoft will benefit big-time from all things AI. The real question is just how big a price the benefit will be worth. 14x is a big price indeed.
Implied Volatility (IV)
Implied volatility has dropped sharply since the last time MSFT was trading at such a lofty valuation multiple. Low levels of IV are many times a reliable contrary indicator that complacency is nearing an extreme.
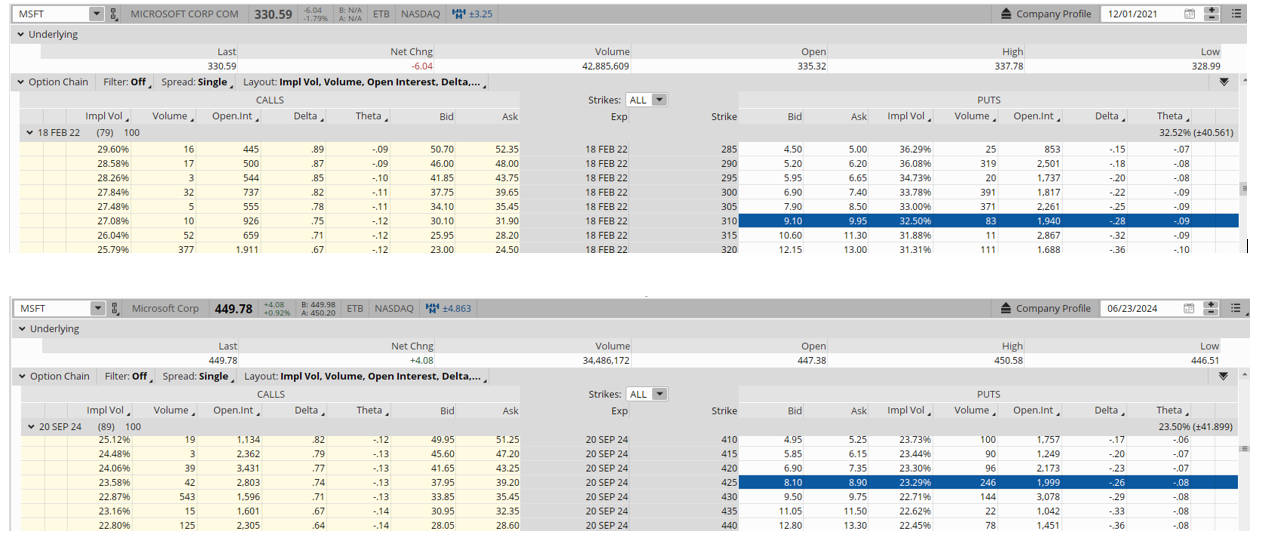
The option montage below compares the roughly 5% out-of-the money put prices from December 1, 2021, versus now.

I put together a quick table shown below highlighting the differences between now and the last time MSFT was trading at such extreme valuations from a put price perspective.

As you can see, the puts back then had less time to expiration (79 days versus 89) and were further out-of-the money (6.23% versus 5.51%). Plus, the stock price was nearly $120 points lower.
Normally less time to expiration, a further out-of-the money strike and a much lower share price makes for cheaper option prices.
Instead, the puts back then were trading at significantly higher prices than current similar puts.
Why? The big drop in IV from over 32 to under 24 makes the current puts $1.00 cheaper even with the stock over $100 higher.
Comparative Performance
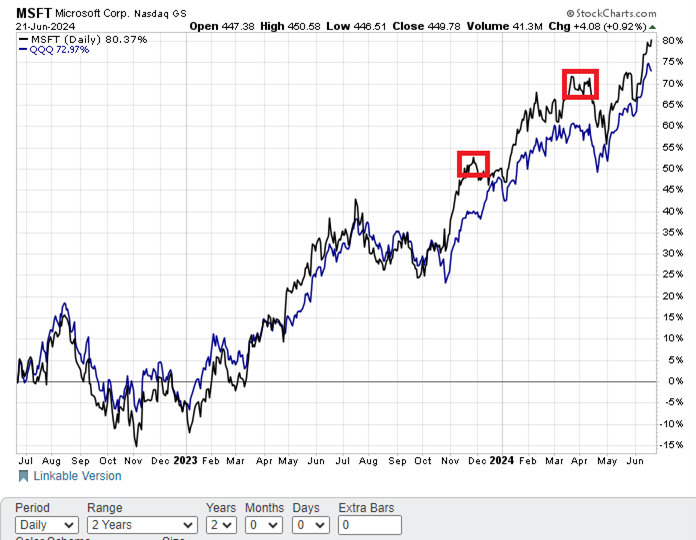
Microsoft is normally highly correlated to the NASDAQ 100 ETF (QQQ). This makes sense since MSFT shares have such a large weighting in QQQ (currently 8.56%).

Lately, however, the correlation is breaking down. MSFT stock is now trading at a big premium to QQQ. Previous instances it diverged to such a large degree signaled a pullback in Microsoft shares.
Investors and traders alike may want to consider positioning for a potential pullback in Microsoft stock. Extremes in valuation, cheap put prices and an overly red-hot rally all increase the probabilities of the potential pullback.
At the end of the day, trading is all about probabilities and not certainty.
This is the type of analysis we employ every day at POWR Options to try and put the odds in your favor.
POWR Options
What To Do Next?
If you’re looking for the best options trades for today’s market, you should check out our latest presentation How to Trade Options with the POWR Ratings. Here we show you how to consistently find the top options trades, while minimizing risk.
If that appeals to you, and you want to learn more about this powerful new options strategy, then click below to get access to this timely investment presentation now:
How to Trade Options with the POWR Ratings
All the Best!
Tim Biggam
Editor, POWR Options Newsletter
Want More Great Investing Ideas?
MSFT shares closed at $449.78 on Friday, up $4.08 (+0.92%). Year-to-date, MSFT has gained 20.05%, versus a 14.91% rise in the benchmark S&P 500 index during the same period.
About the Author: Tim Biggam

Tim spent 13 years as Chief Options Strategist at Man Securities in Chicago, 4 years as Lead Options Strategist at ThinkorSwim and 3 years as a Market Maker for First Options in Chicago. He makes regular appearances on Bloomberg TV and is a weekly contributor to the TD Ameritrade Network "Morning Trade Live". His overriding passion is to make the complex world of options more understandable and therefore more useful to the everyday trader. Tim is the editor of the POWR Options newsletter. Learn more about Tim's background, along with links to his most recent articles. More...
More Resources for the Stocks in this Article
| Ticker | POWR Rating | Industry Rank | Rank in Industry |
| MSFT | Get Rating | Get Rating | Get Rating |


