Microsoft Corp. (MSFT): Price and Financial Metrics
MSFT Price/Volume Stats
Current price | $331.21 | 52-week high | $335.74 |
Prev. close | $332.89 | 52-week low | $213.43 |
Day low | $330.52 | Volume | 29,465,276 |
Day high | $335.74 | Avg. volume | 30,740,754 |
50-day MA | $297.12 | Dividend yield | 0.82% |
200-day MA | $260.62 | Market Cap | 2.46T |
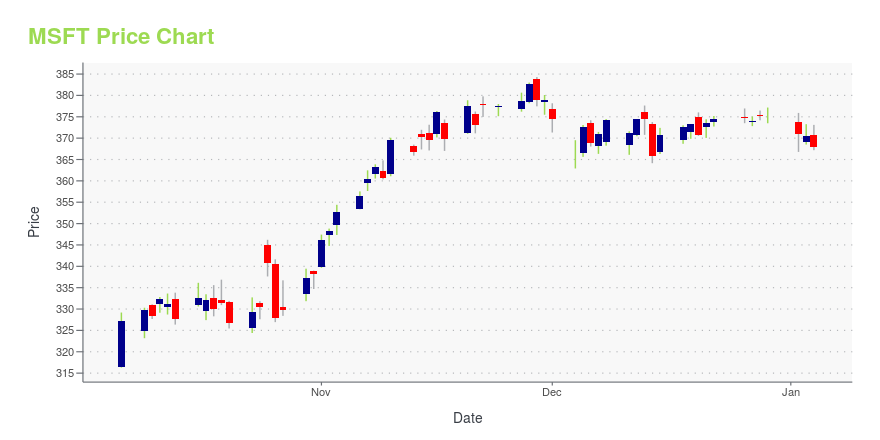
MSFT Stock Price Chart Interactive Chart >
MSFT POWR Grades
- MSFT scores best on the Sentiment dimension, with a Sentiment rank ahead of 94.61% of US stocks.
- The strongest trend for MSFT is in Stability, which has been heading up over the past 179 days.
- MSFT's current lowest rank is in the Value metric (where it is better than 27.56% of US stocks).
MSFT Stock Summary
- MICROSOFT CORP's market capitalization of $2,333,627,775,414 is ahead of 99.98% of US-listed equities.
- With a one year PEG ratio of 1,246.46, MICROSOFT CORP is expected to have a higher PEG ratio (a measure of how expensive a stock is relative to its expected earnings growth) than 98.28% of US stocks.
- MICROSOFT CORP's stock had its IPO on March 13, 1986, making it an older stock than 93.54% of US equities in our set.
- Stocks that are quantitatively similar to MSFT, based on their financial statements, market capitalization, and price volatility, are AAPL, GOOGL, AMZN, NVDA, and BRK.B.
- MSFT's SEC filings can be seen here. And to visit MICROSOFT CORP's official web site, go to www.microsoft.com.
MSFT Valuation Summary
- MSFT's EV/EBIT ratio is 26.9; this is 27.19% higher than that of the median Technology stock.
- MSFT's price/sales ratio has moved up 3.1 over the prior 243 months.
Below are key valuation metrics over time for MSFT.
Stock | Date | P/S | P/B | P/E | EV/EBIT |
---|---|---|---|---|---|
MSFT | 2023-05-22 | 11.5 | 12.3 | 34.6 | 26.9 |
MSFT | 2023-05-19 | 11.4 | 12.2 | 34.3 | 26.7 |
MSFT | 2023-05-18 | 11.4 | 12.2 | 34.3 | 26.7 |
MSFT | 2023-05-17 | 11.2 | 12.0 | 33.8 | 26.3 |
MSFT | 2023-05-16 | 11.2 | 11.9 | 33.6 | 26.1 |
MSFT | 2023-05-15 | 11.1 | 11.8 | 33.3 | 25.9 |
MSFT Growth Metrics
- The 3 year net income to common stockholders growth rate now stands at 107.46%.
- The 5 year price growth rate now stands at 159.89%.
- Its 5 year revenue growth rate is now at 58.97%.

The table below shows MSFT's growth in key financial areas (numbers in millions of US dollars).
Date | Revenue | Operating Cash Flow | Net Income to Common Stock |
---|---|---|---|
2022-12-31 | 204,094 | 84,386 | 67,449 |
2022-09-30 | 203,075 | 87,693 | 69,789 |
2022-06-30 | 198,270 | 89,035 | 72,738 |
2022-03-31 | 192,557 | 87,116 | 72,456 |
2021-12-31 | 184,903 | 83,909 | 71,185 |
2021-09-30 | 176,251 | 81,945 | 67,883 |
MSFT's Quality Factors
The “Quality” component of the POWR Ratings focuses on 31 different factors of a companies fundamentals and operational strength. Here are some key insights as we drill into the specifics of these quality attributes.- MSFT has a Quality Grade of B, ranking ahead of 93.25% of graded US stocks.
- MSFT's asset turnover comes in at 0.55 -- ranking 290th of 561 Business Services stocks.
- NEO, GRPN, and SGRP are the stocks whose asset turnover ratios are most correlated with MSFT.
The table below shows MSFT's key quality metrics over time.
Period | Asset Turnover | Gross Margin | ROIC |
---|---|---|---|
2021-09-30 | 0.550 | 0.689 | 0.606 |
2021-06-30 | 0.539 | 0.689 | 0.589 |
2021-03-31 | 0.527 | 0.684 | 0.553 |
2020-12-31 | 0.514 | 0.684 | 0.524 |
2020-09-30 | 0.503 | 0.683 | 0.494 |
2020-06-30 | 0.498 | 0.678 | 0.467 |
MSFT Price Target
For more insight on analysts targets of MSFT, see our MSFT price target page. And for a list of of all stocks sorted by upside potential based on analyst target price, see our Top Price Target page.
Average Price Target | $333.38 | Average Broker Recommendation | 1.34 (Strong Buy) |
Microsoft Corp. (MSFT) Company Bio
Microsoft Corp. was founded in 1975 by computing pioneers Bill Gates and Paul Allen. The company's best known software products are the Microsoft Windows operating systems, the Microsoft Office suite, and the Internet Explorer and Edge web browsers. Over the decades, Microsoft has continued to diversify its product and services offerings, including consumer and enterprise software for desktops, laptops, tabs, gadgets, and servers, including Internet search (with Bing), the digital services market (through MSN), mixed reality (HoloLens), cloud computing (Azure), and software development (Visual Studio). In 2019, Microsoft became the third publicly traded company to reach a market cap of over 1 trillion US dollars, and is the third-highest global brand valuation as of 2020 -- often switching places with its two primary technology peers, Apple and Alphabet.
Latest MSFT News From Around the Web
Below are the latest news stories about MICROSOFT CORP that investors may wish to consider to help them evaluate MSFT as an investment opportunity.
Short-Term Pain Setting Up Long-Term Stock Market GainsLast year, energy stocks were the darlings while mega-cap tech companies were crushed. This year, energy and small-cap equities have been dead weight while mega-cap technology stocks have regained their leadership. |
Reflections On Investing: US Tech Stocks – The Big Get BiggerFive US tech companies account for 25% of the S&P 500 market cap. This video discusses the resurgence of big US tech and what it means for investors. |
Benefit From The Tech Rally And Get IncomeFor months, the share prices of most stocks have been in the doldrums or worse. Large-cap tech stocks have been the exception. Let’s check how a couple of covered call ETFs have performed compared to the most popular tech stock ETF. |
AI Industry Outlook: 3 Things to Expect for the Second Half of 2023AI news in business-news outlets is focusing on only a few angles at this point. |
3 Momentum Stocks to Make You the Millionaire Next DoorKeep your eyes on these momentum stocks to own if you aim to become a millionaire with your long-term investments. |
MSFT Price Returns
1-mo | 8.03% |
3-mo | 34.78% |
6-mo | 30.66% |
1-year | N/A |
3-year | 85.76% |
5-year | 254.30% |
YTD | 38.76% |
2022 | -28.02% |
2021 | 52.48% |
2020 | 42.53% |
2019 | 57.56% |
2018 | 20.80% |
MSFT Dividends
Ex-Dividend Date | Type | Payout Amount | Change | ||||||
---|---|---|---|---|---|---|---|---|---|
Loading, please wait... |
Continue Researching MSFT
Want to see what other sources are saying about Microsoft Corp's financials and stock price? Try the links below:Microsoft Corp (MSFT) Stock Price | Nasdaq
Microsoft Corp (MSFT) Stock Quote, History and News - Yahoo Finance
Microsoft Corp (MSFT) Stock Price and Basic Information | MarketWatch
Loading social stream, please wait...