

It was a month ago that I wrote about some reasons to be cautious on the red-hot rally in Microsoft (MSFT) continuing.
https://stocknews.com/news/msft-3-reasons-why-ai-may-mean-artificially-inflated-for-microsoft/
Valuations, Comparative Performance and Implied Volatility (IV) were all at extremes. Usually, extremes tend to eventually become less extreme.
That indeed was the case in Microsoft and many more too hot to handle AI names.
Let’s look at how things have changed from a month ago until now.
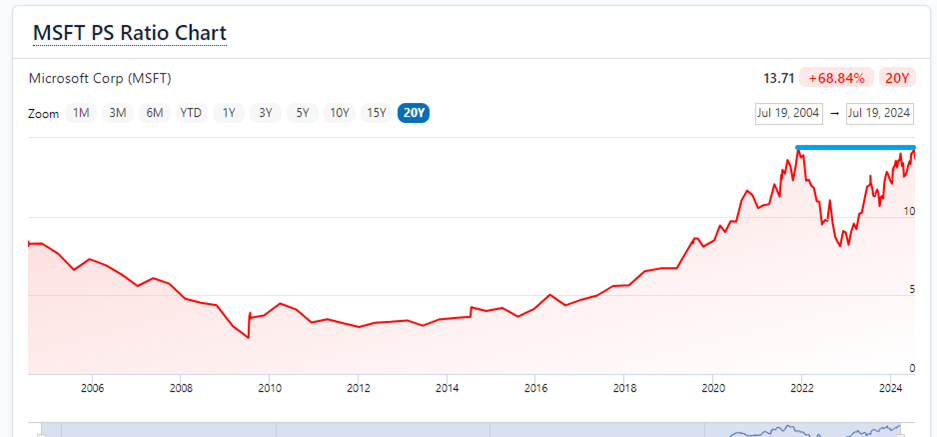
Valuations
In my previous article from June 23, I noted how Microsoft was trading at the highest price to sale (P/S) multiple ever. It had gotten to well over 14x (14.23) which matched the previous extreme from December 2021.
Now the current P/S has indeed tempered somewhat to under 14x (13.71). Still extreme, but slightly more reasonable.
Comparative Performance
Microsoft is one of the top two holdings in the NASDAQ 100 (QQQ), vying with AAPL for the top spot daily. It accounts for about 9% of the overall weighting in QQQ.
One would expect MSFT and QQQ to be normally highly correlated-which they normally are. There have been instances in the past, however, when MSFT briefly outperformed QQQ to a large degree.
These instances were invariably met with Microsoft reverting back to QQQ over the past two years, as shown in the chart below from my analytic piece on June 23.
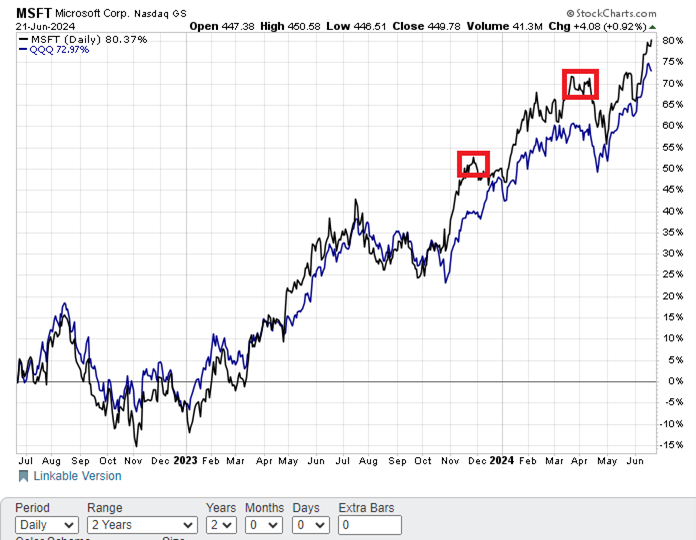
Once again, Microsoft was outperforming the NASDAQ 100 in a meaningful way. The performance differential reached well over 7%.
I expected Microsoft to have trouble maintaining this outperformance given the prior history.
Indeed, this was the case. Microsoft dropped at a much faster clip than the NASDAQ 100 and closed the performance differential from over 7% to under 4% as the chart below shows.
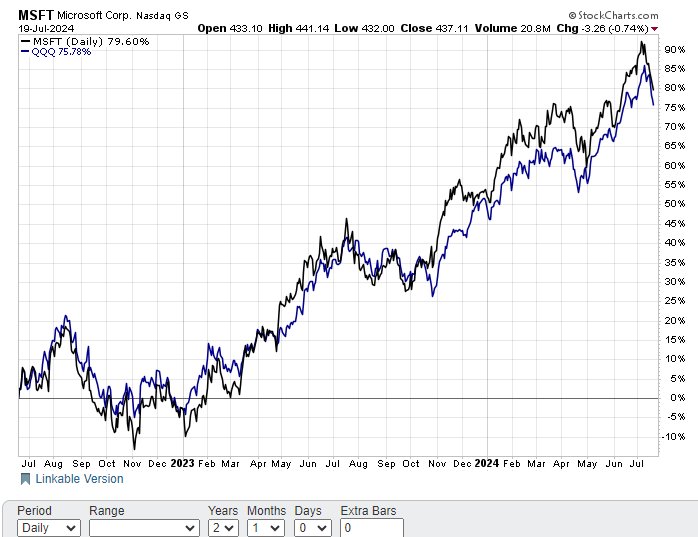
Reversion to the mean is ultimately one of the most powerful forces in finance.
Implied Volatility
I pulled off a comparison of the put option example from June 23 versus the latest close on Friday, July 19 (shown below).
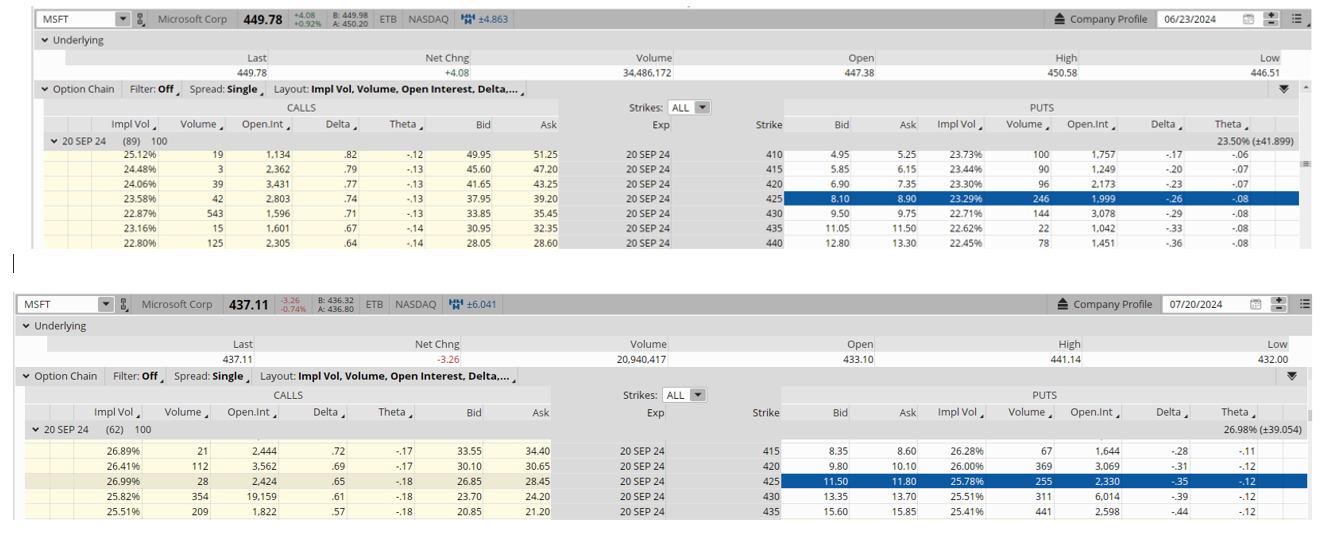
MSFT stock dropped over $12 points from $449.78 to $437.11-or just under 3%. The smoothed delta on the options was about .30 over the comparative time frame. Means the expected delta gain should be about $3.80.
Days to expiration (DTE) went from 89 to 62, so one would expect about 10 cents a day in time decay given the roughly .10 theta. This would equate to a time decay loss of $2.70 on the puts.
The combination of positive stock move lower negated by time decay points to an expected gain of $1.10 ($3.80 less $2.70) in the September $425 puts.
Yet the puts rose just over 3 points from $8.50 to $11.65. Why? Implied volatility rose sharply.
One can see that the implied volatility (IV) of the September $425 put options rose over 10% from 23.29 to 25.78. This means the increase in IV accounted for 2 points of the overall 3 point rise in the September $425 puts.
Highlights the importance of IV analysis in constructing trades.
Notice also the leverage effect options can provide. A 3% drop in MSFT stock resulted in a 37% gain ($3.10/$8.50) in the MSFT September $425 puts.
Plus, the initial cost of the put option was less than 2% of the cost of the stock price.
Much lower cost and much bigger potential returns.
This is the type of in-depth analysis we use to uncover trading edges at POWR Options.
Not every trade works out in the same way this MSFT put play did. Trading, after all, is all about probability and not certainty.
But those looking to put the odds in their favor may want to give POWR Options a try.
POWR Options
What To Do Next?
If you’re looking for the best options trades for today’s market, you should check out our latest presentation How to Trade Options with the POWR Ratings. Here we show you how to consistently find the top options trades, while minimizing risk.
If that appeals to you, and you want to learn more about this powerful new options strategy, then click below to get access to this timely investment presentation now:
How to Trade Options with the POWR Ratings
All the Best!
Tim Biggam
Editor, POWR Options Newsletter
Want More Great Investing Ideas?
MSFT shares closed at $437.11 on Friday, down $-3.26 (-0.74%). Year-to-date, MSFT has gained 16.67%, versus a 16.23% rise in the benchmark S&P 500 index during the same period.
About the Author: Tim Biggam
Tim spent 13 years as Chief Options Strategist at Man Securities in Chicago, 4 years as Lead Options Strategist at ThinkorSwim and 3 years as a Market Maker for First Options in Chicago. He makes regular appearances on Bloomberg TV and is a weekly contributor to the TD Ameritrade Network "Morning Trade Live". His overriding passion is to make the complex world of options more understandable and therefore more useful to the everyday trader. Tim is the editor of the POWR Options newsletter. Learn more about Tim's background, along with links to his most recent articles. More...
More Resources for the Stocks in this Article
| Ticker | POWR Rating | Industry Rank | Rank in Industry |
| MSFT | Get Rating | Get Rating | Get Rating |


