

When looking at the charts, I spotted a horizontal channel forming in MSC Industrial Direct Co. (MSM - Get Rating) since the end of May. MSM distributes metalworking and maintenance, repair, and operations products in the United States, Canada, Mexico, and the United Kingdom.
A horizontal channel occurs when an asset’s, in this case a stock, price is ranging within a sideways support and resistance zone.
Channels are used by technical analysts to identify areas where breakout trades could form. A breakout is when the price of an asset moves above a resistance level or below a support level. A breakout to the upside signals traders to buy the asset or cover short positions, while a breakout to the downside signals traders to get short or sell long positions.
Let’s take a look at the 1-year chart of MSM with added notations:
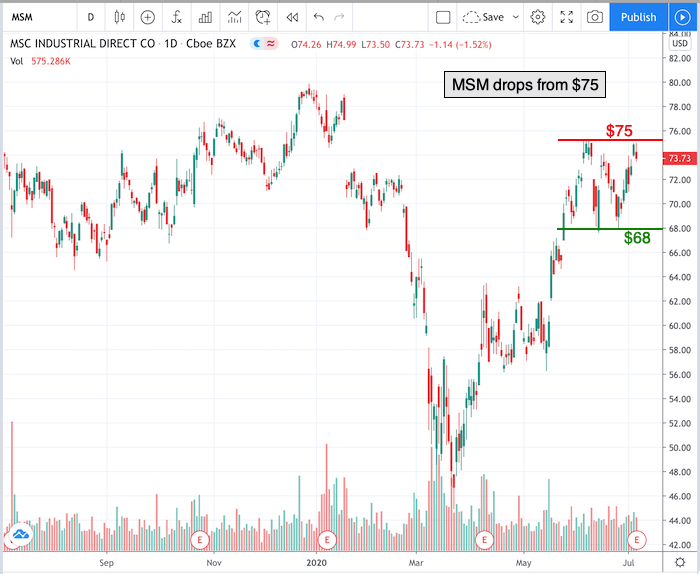
Chart of MSM provided by TradingView
After hitting its low in March, MSM rallied above $68 in late May. Since then, the stock has been fluctuating within a range. A support level has formed at $68 (green) and a resistance level at $75 (red).
As I’m writing this article, MSM is trading about $70, which is within the horizontal channel.
There are two possible trades I am waiting patiently for:
- The stock moves higher, over the $75 resistance level. If/when that happens, a breakout to the upside could occur.
- The stock moves lower, under the $68 support level. If/when that happens, a breakout to the downside could occur.
I will be keeping a close eye on MSM today because this morning it released its quarterly earnings report. MSM reported earnings of $1.40 per share, compared to earnings of $1.45 per share a year ago. The company posted revenues of $834.97 million for the quarter ended May 2020.
Have a good trading day!
Christian Tharp, CMT
@cmtstockcoach
Stock Trading & Investing for Everyone
Want More Great Investing Ideas?
9 “BUY THE DIP” Growth Stocks for 2020
Is the Bull S#*t Rally FINALLY Over?
7 “Safe-Haven” Dividend Stocks for Turbulent Times
Top 3 Investing Strategies for 2020
MSM shares were trading at $69.63 per share on Wednesday morning, down $4.10 (-5.56%). Year-to-date, MSM has declined -2.88%, versus a -0.88% rise in the benchmark S&P 500 index during the same period.
About the Author: christian

Christian is an expert stock market coach at the Adam Mesh Trading Group who has mentored more than 4,000 traders and investors. He is a professional technical analyst that is a certified Chartered Market Technician (CMT), which is a designation awarded by the CMT Association. Christian is also the author of the daily online newsletter Todays Big Stock. More...
More Resources for the Stocks in this Article
| Ticker | POWR Rating | Industry Rank | Rank in Industry |
| MSM | Get Rating | Get Rating | Get Rating |


