
MSC Industrial Direct Company, Inc. (MSM): Price and Financial Metrics
MSM Price/Volume Stats
| Current price | $87.63 | 52-week high | $105.77 |
| Prev. close | $85.66 | 52-week low | $75.05 |
| Day low | $86.46 | Volume | 674,800 |
| Day high | $88.11 | Avg. volume | 554,112 |
| 50-day MA | $83.26 | Dividend yield | 3.98% |
| 200-day MA | $93.79 | Market Cap | 4.92B |
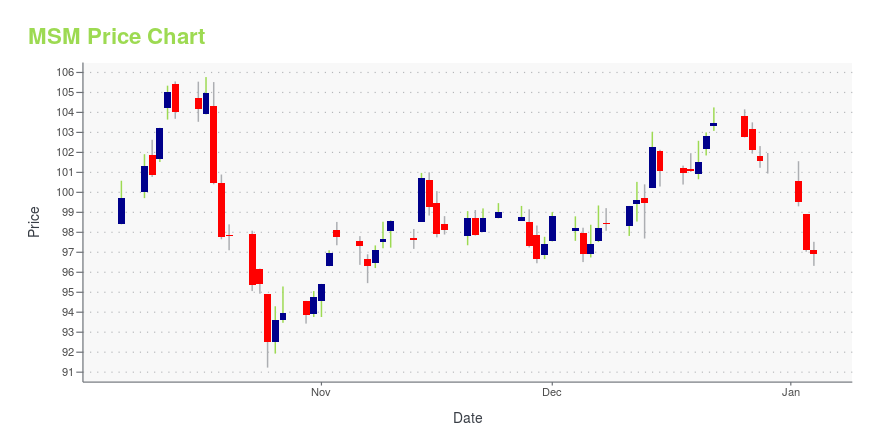
MSM Stock Price Chart Interactive Chart >
MSC Industrial Direct Company, Inc. (MSM) Company Bio
MSC Industrial Direct is a North American distributor of metalworking and maintenance, repair, and operations (MRO) products and services. The company was founded in 1941 and is based in Melville, New York.
Latest MSM News From Around the Web
Below are the latest news stories about MSC INDUSTRIAL DIRECT CO INC that investors may wish to consider to help them evaluate MSM as an investment opportunity.
MSC Industrial (MSM) Shares Gain 30.4% YTD: What's Driving It?MSC Industrial (MSM) is well-poised to deliver revenue growth, aided by acquisitions, price and strong momentum in growth initiatives. |
MSC INDUSTRIAL SUPPLY CO. RELEASES 2023 ESG REPORTMSC Industrial Supply Co. (NYSE: MSM), a premier distributor of Metalworking and Maintenance, Repair and Operations (MRO) products and services to industrial customers throughout North America, today reaffirmed its commitment to Environmental, Social, and Governance (ESG) principles in its 2023 ESG Report, "BETTER: Better World, Better Tomorrow." |
3 Hot Megatrends for Smart Investors in 2024 (and 3 Stocks You've Never Heard Of)Automation, reshoring manufacturing to the U.S., and infrastructure spending are powerful investing themes for the coming decade. |
MSC INDUSTRIAL SUPPLY CO. DECLARES REGULAR QUARTERLY DIVIDENDMSC Industrial Supply Co. (NYSE: MSM), a premier distributor of Metalworking and Maintenance, Repair and Operations (MRO) products and services to industrial customers throughout North America, today announced that its Board of Directors has declared a cash dividend of $0.83 per share. The $0.83 dividend is payable on January 23, 2024 to shareholders of record at the close of business on January 9, 2024. The ex-dividend date is January 8, 2024. |
MSC INDUSTRIAL SUPPLY CO. TO WEBCAST REVIEW OF FISCAL 2024 FIRST QUARTER RESULTSMSC INDUSTRIAL SUPPLY CO. (NYSE: MSM), a premier distributor of Metalworking and Maintenance, Repair and Operations (MRO) products and services to industrial customers throughout North America, today announced that the Company's conference call to review its fiscal year 2024 first quarter results, as well as its current operations, will be broadcast live over the Internet Tuesday, January 9, 2024 at 8:30 a.m. Eastern Time. |
MSM Price Returns
| 1-mo | 13.55% |
| 3-mo | -4.98% |
| 6-mo | -8.62% |
| 1-year | -9.00% |
| 3-year | 10.50% |
| 5-year | 66.73% |
| YTD | -10.98% |
| 2023 | 28.52% |
| 2022 | 0.90% |
| 2021 | 3.09% |
| 2020 | 25.33% |
| 2019 | 5.76% |
MSM Dividends
| Ex-Dividend Date | Type | Payout Amount | Change | ||||||
|---|---|---|---|---|---|---|---|---|---|
| Loading, please wait... | |||||||||
Continue Researching MSM
Here are a few links from around the web to help you further your research on Msc Industrial Direct Co Inc's stock as an investment opportunity:Msc Industrial Direct Co Inc (MSM) Stock Price | Nasdaq
Msc Industrial Direct Co Inc (MSM) Stock Quote, History and News - Yahoo Finance
Msc Industrial Direct Co Inc (MSM) Stock Price and Basic Information | MarketWatch
Loading social stream, please wait...