
A symmetrical triangle pattern has emerged in the chart of SM Energy Company (SM). When this pattern is broken, a strong move is expected.
SM is an independent energy company engaged in the acquisition, exploration, development, and production of crude oil and condensate, natural gas, and natural gas liquids.
The company relies on its fleet of geologists, geophysicists, landmen, and engineers to help extract the full potential out of all properties held. The company’s oil and gas investments, diverse portfolio of proved reserves, and drilling opportunities are helping to create long-term value for shareholders.
SM’s balance sheet is concerning as it has a current ratio under 1 (0.4), which indicates it doesn’t have enough liquidity to handle short-term obligations. Its profitability numbers are also negative. In its most recently reported quarter, the company’s earnings rose from -0.04 to $0.02 and its revenue fell from $451.7 to $320.3 million.
SM’s price-to-sales ratio of 1.8 is in line with the industry average, while its price to book is lower. The stock had been trending up since November, but has shown mixed performance as of late. This has resulted in a Momentum Grade of B in our POWR Ratings service.
Take a look at the 1-year chart of SM below with my added notations:
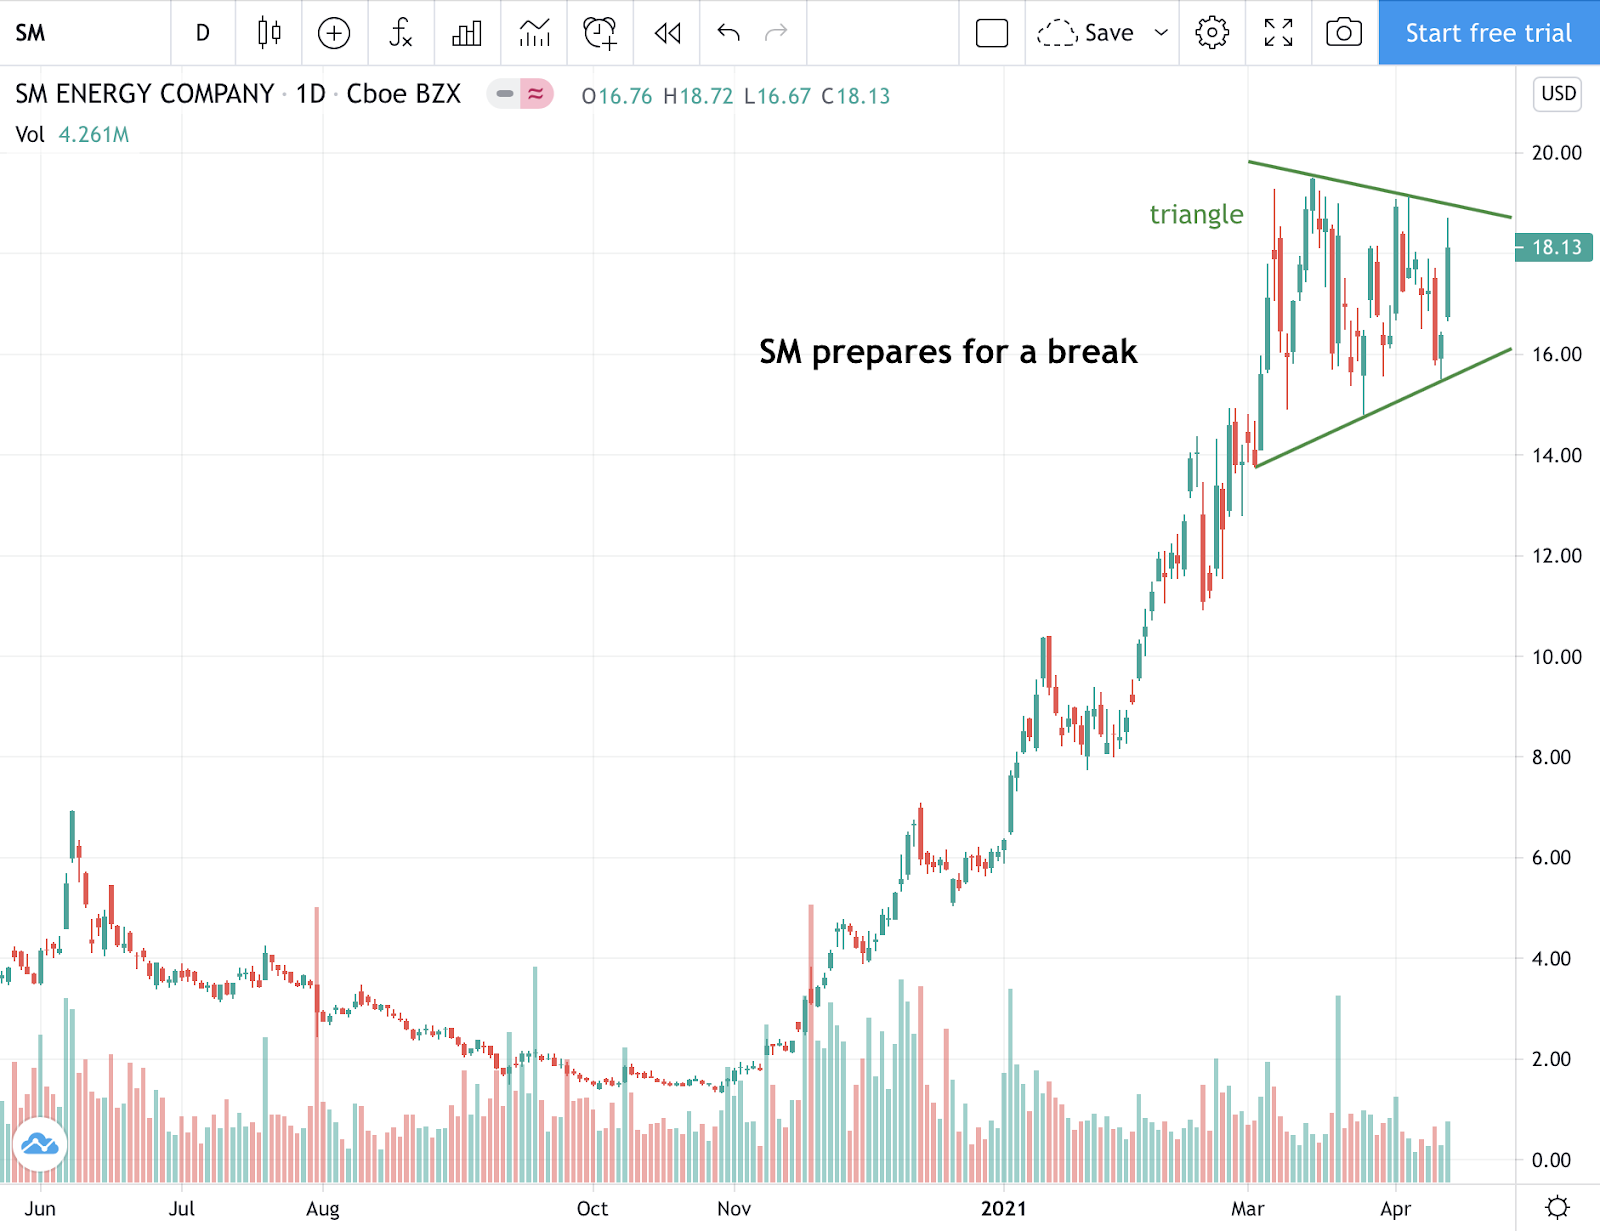
SM has created a common chart pattern known as a symmetrical triangle. A down trending resistance combined with an up-trending support forms the triangle pattern (green).
There is no way to know which way the stock will break. A trader could enter a long position on a break above the down trending resistance with a protective stop set under the entry level. However, if the stock were to break below the trend line support, a short trade could be entered with a protective stop above the trend line.
Want to Discover More Great Trades?
I have explored virtually every flavor of technical analysis and chart pattern known to mankind. The sad fact is that the vast majority of them don’t work at all.
That is why I recently put together this special report to help investors focus on the only 5 chart patterns that matter…the ones that lead to the most timely and profitable stock trades. Click below to get your copy now!
5 WINNING Stock Chart Patterns
Have a good trading day!
Good luck!
Christian Tharp, CMT
Want More Great Investing Ideas?
SM shares rose $0.13 (+0.72%) in premarket trading Thursday. Year-to-date, SM has gained 198.53%, versus a 10.98% rise in the benchmark S&P 500 index during the same period.
About the Author: Christian Tharp

I am an expert stock market coach having helped over 4000 beginner and advanced traders & investors from around the world take control of their financial futures. I also write stock market related articles for the Adam Mesh Trading Group and Yolo Publishing. More...
More Resources for the Stocks in this Article
| Ticker | POWR Rating | Industry Rank | Rank in Industry |
| SM | Get Rating | Get Rating | Get Rating |