SM Energy Company (SM): Price and Financial Metrics

SM Energy Company (SM): $40.66

1.92 (+4.96%)

POWR Rating

Component Grades

Momentum

C

Stability

D

Sentiment

Quality

B

Add SM to Watchlist
Sign Up

Industry: Energy - Oil & Gas

Industry

C

Ranked

#33 of 89

in industry

SM Price/Volume Stats

Current price $40.66 52-week high $48.55
Prev. close $38.74 52-week low $24.66
Day low $39.28 Volume 1,294,600
Day high $40.97 Avg. volume 1,780,182
50-day MA $39.00 Dividend yield 1.61%
200-day MA $32.38 Market Cap 4.83B

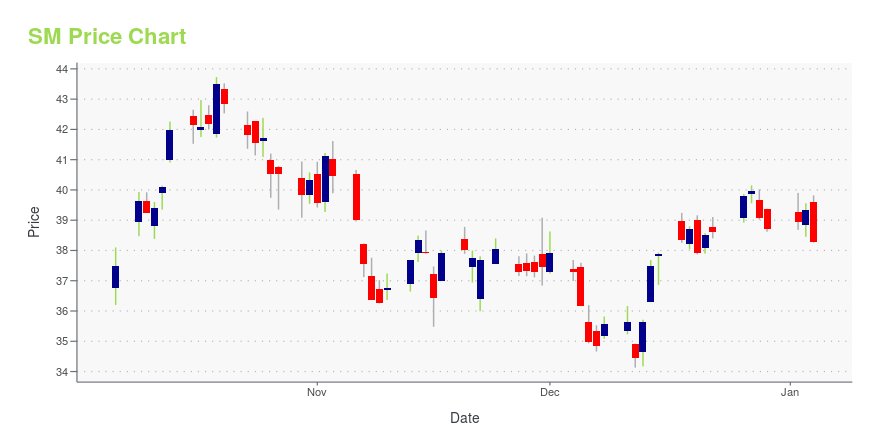
SM Stock Price Chart Interactive Chart >

SM POWR Grades

  • SM scores best on the Quality dimension, with a Quality rank ahead of 86.31% of US stocks.
  • The strongest trend for SM is in Value, which has been heading down over the past 177 days.
  • SM ranks lowest in Growth; there it ranks in the 3rd percentile.

SM Stock Summary

  • With a price/earnings ratio of 4.06, SM ENERGY CO P/E ratio is greater than that of about just 5.3% of stocks in our set with positive earnings.
  • Price to trailing twelve month operating cash flow for SM is currently 2.91, higher than only 10.7% of US stocks with positive operating cash flow.
  • Of note is the ratio of SM ENERGY CO's sales and general administrative expense to its total operating expenses; just 4.93% of US stocks have a lower such ratio.
  • Stocks that are quantitatively similar to SM, based on their financial statements, market capitalization, and price volatility, are MMAT, KOS, MRO, IRWD, and TDOC.
  • SM's SEC filings can be seen here. And to visit SM ENERGY CO's official web site, go to www.sm-energy.com.

SM Valuation Summary

  • In comparison to the median Energy stock, SM's price/sales ratio is 28.57% higher, now standing at 1.8.
  • Over the past 243 months, SM's EV/EBIT ratio has gone down 3.8.

Below are key valuation metrics over time for SM.

Stock Date P/S P/B P/E EV/EBIT
SM 2023-09-14 1.8 1.5 4.4 4.1
SM 2023-09-13 1.8 1.5 4.4 4.1
SM 2023-09-12 1.9 1.5 4.5 4.2
SM 2023-09-11 1.8 1.4 4.4 4.1
SM 2023-09-08 1.9 1.5 4.5 4.2
SM 2023-09-07 1.9 1.5 4.6 4.2

SM Growth Metrics

    Its 3 year net cashflow from operations growth rate is now at 99.75%.
  • The year over year net cashflow from operations growth rate now stands at 105.8%.
  • Its 3 year price growth rate is now at 140.72%.
SM's revenue has moved up $1,753,738,000 over the prior 34 months.

The table below shows SM's growth in key financial areas (numbers in millions of US dollars).

Date Revenue Operating Cash Flow Net Income to Common Stock
2022-12-31 3,358.647 1,686.406 1,111.952
2022-09-30 3,542.289 1,827.661 1,278.389
2022-06-30 3,467.077 1,642.41 882.742
2022-03-31 3,038.824 1,396.24 336.262
2021-12-31 2,622.894 1,159.772 36.229
2021-09-30 2,088.226 987.002 -553.846

SM's Quality Factors

The “Quality” component of the POWR Ratings focuses on 31 different factors of a companies fundamentals and operational strength. Here are some key insights as we drill into the specifics of these quality attributes.
  • SM has a Quality Grade of B, ranking ahead of 76.52% of graded US stocks.
  • SM's asset turnover comes in at 0.415 -- ranking 65th of 137 Petroleum and Natural Gas stocks.
  • FANG, ESTE, and TGA are the stocks whose asset turnover ratios are most correlated with SM.

The table below shows SM's key quality metrics over time.

Period Asset Turnover Gross Margin ROIC
2021-09-30 0.415 0.781 -0.067
2021-06-30 0.319 0.740 -0.096
2021-03-31 0.238 0.693 -0.077
2020-12-31 0.215 0.653 -0.109
2020-09-30 0.226 0.664 -0.094
2020-06-30 0.231 0.666 -0.067

SM Price Target

For more insight on analysts targets of SM, see our SM price target page. And for a list of of all stocks sorted by upside potential based on analyst target price, see our Top Price Target page.

Average Price Target $27.92 Average Broker Recommendation 1.75 (Moderate Buy)

SM Energy Company (SM) Company Bio


SM Energy is an independent energy company engaged in the acquisition, exploration, development, and production of crude oil, natural gas, and natural gas liquids in onshore North America. The company was founded in 1908 and is based in Denver, Colorado.


SM Latest News Stream


Event/Time News Detail
Loading, please wait...

SM Latest Social Stream


Loading social stream, please wait...

View Full SM Social Stream

Latest SM News From Around the Web

Below are the latest news stories about SM ENERGY CO that investors may wish to consider to help them evaluate SM as an investment opportunity.

Is SM Energy Company (NYSE:SM) Trading At A 23% Discount?

Key Insights SM Energy's estimated fair value is US$48.37 based on 2 Stage Free Cash Flow to Equity SM Energy's...

Yahoo | September 23, 2023

Is SPDR S&P Oil & Gas Exploration & Production ETF (XOP) a Strong ETF Right Now?

Smart Beta ETF report for XOP

Yahoo | September 19, 2023

Unveiling SM Energy Co (SM)'s Value: Is It Really Priced Right? A Comprehensive Guide

An in-depth analysis of SM Energy Co's valuation, financial strength, profitability, and growth

Yahoo | September 11, 2023

With EPS Growth And More, SM Energy (NYSE:SM) Makes An Interesting Case

For beginners, it can seem like a good idea (and an exciting prospect) to buy a company that tells a good story to...

Yahoo | September 6, 2023

South Texas Drilling Permit Roundup: South Texas drilling triad seeks new wells in Webb County

For the second week in a row, South Texas drillers have dogpiled on the Eagle Ford's southernmost county.

Yahoo | September 5, 2023

Read More 'SM' Stories Here

SM Price Returns

1-mo -0.97%
3-mo 30.43%
6-mo 45.77%
1-year 21.12%
3-year 2,324.71%
5-year 34.55%
YTD 18.39%
2022 18.58%
2021 382.16%
2020 -44.85%
2019 -26.72%
2018 -29.60%

SM Dividends

Ex-Dividend Date Type Payout Amount Change
Loading, please wait...
View Full SM Dividend History

Get Free Updates

Join thousands of investors who get the latest news, insights and top rated picks from StockNews.com!