

The sad fact of the matter is that Spotify is ultimately a terrible business, and a bear market excels at illuminating precisely this type of company. It has painfully low margins, which will make it especially susceptible to downturns. Its layoffs at this time are thus not a surprise. In this article, we’ll take a deeper dive into some of the metrics that illuminate the company’s struggles.
SPOT’s Revenue, Gross Margin, and Return on Invested Capital (ROIC): An Analysis of Two-and-a-Half Years of Financial Data
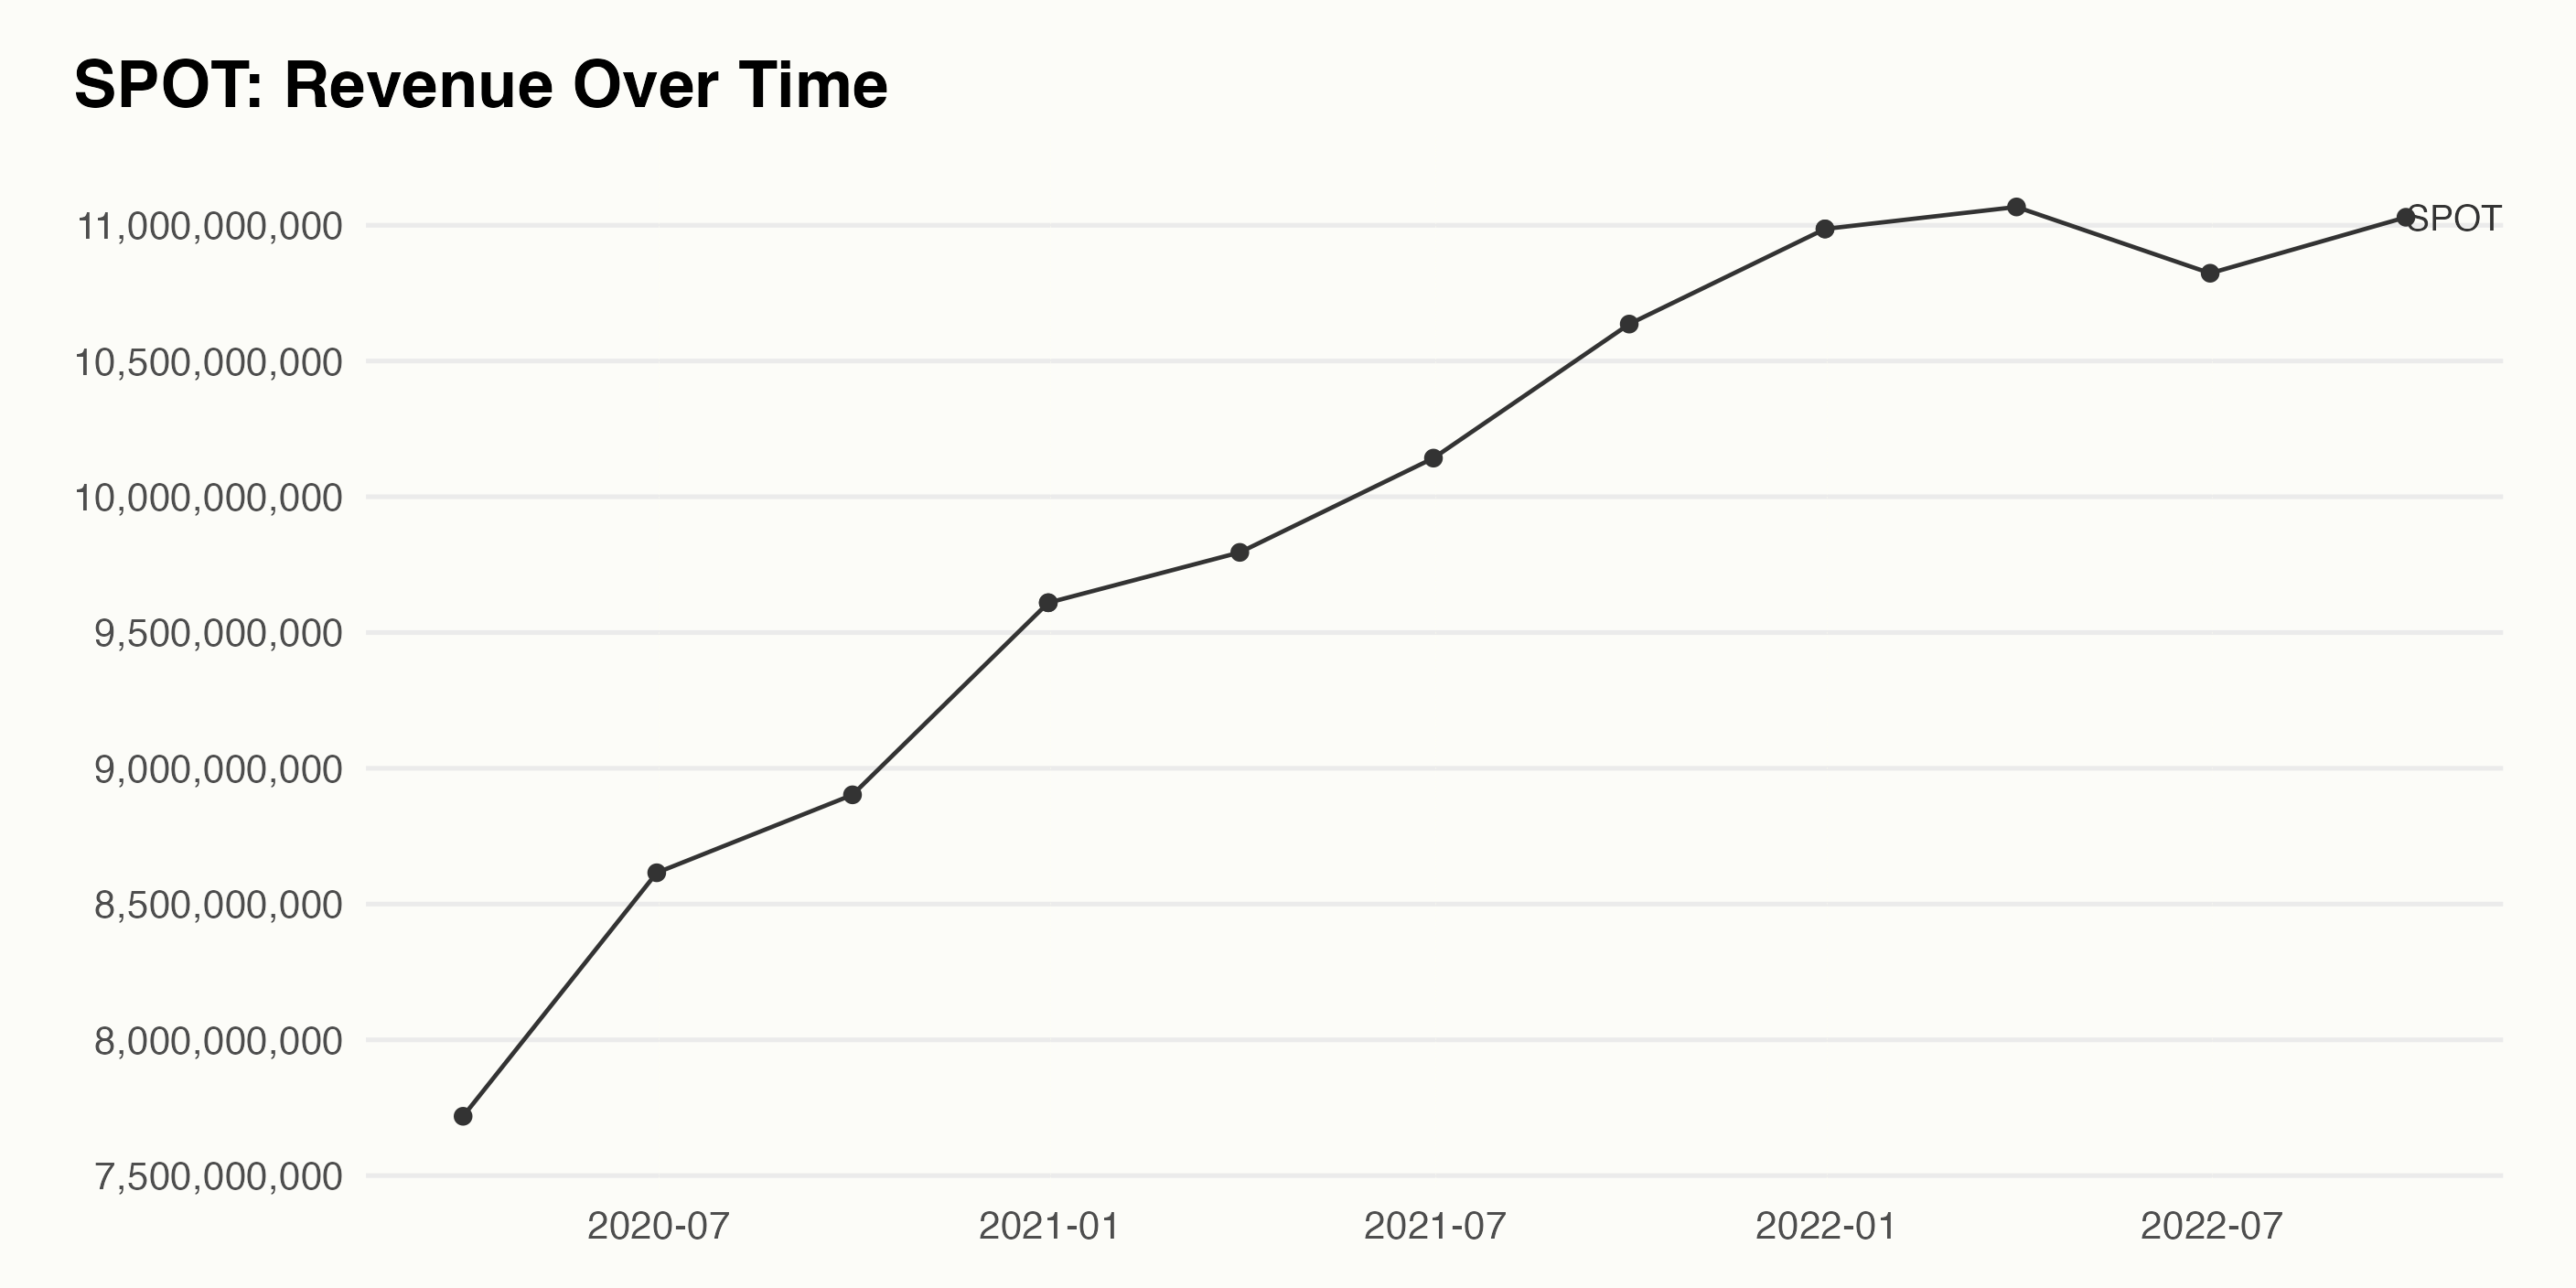
The revenue of SPOT experienced an overall increase over the span of these dates, growing from roughly $7.72 billion in March 2020 to $11.07 billion in March 2021, a 43.1% growth rate. The rate has slowed however, as the most recent numbers have seen only a modest 2.7% increase from the same time the year before. There were several fluctuations throughout the series, such as a 9.9% increase from December 2020 to March 2021; however, the overall trend remains decidedly upward for SPOT’s revenue. Here is a chart of SPOT’s Revenue over time.
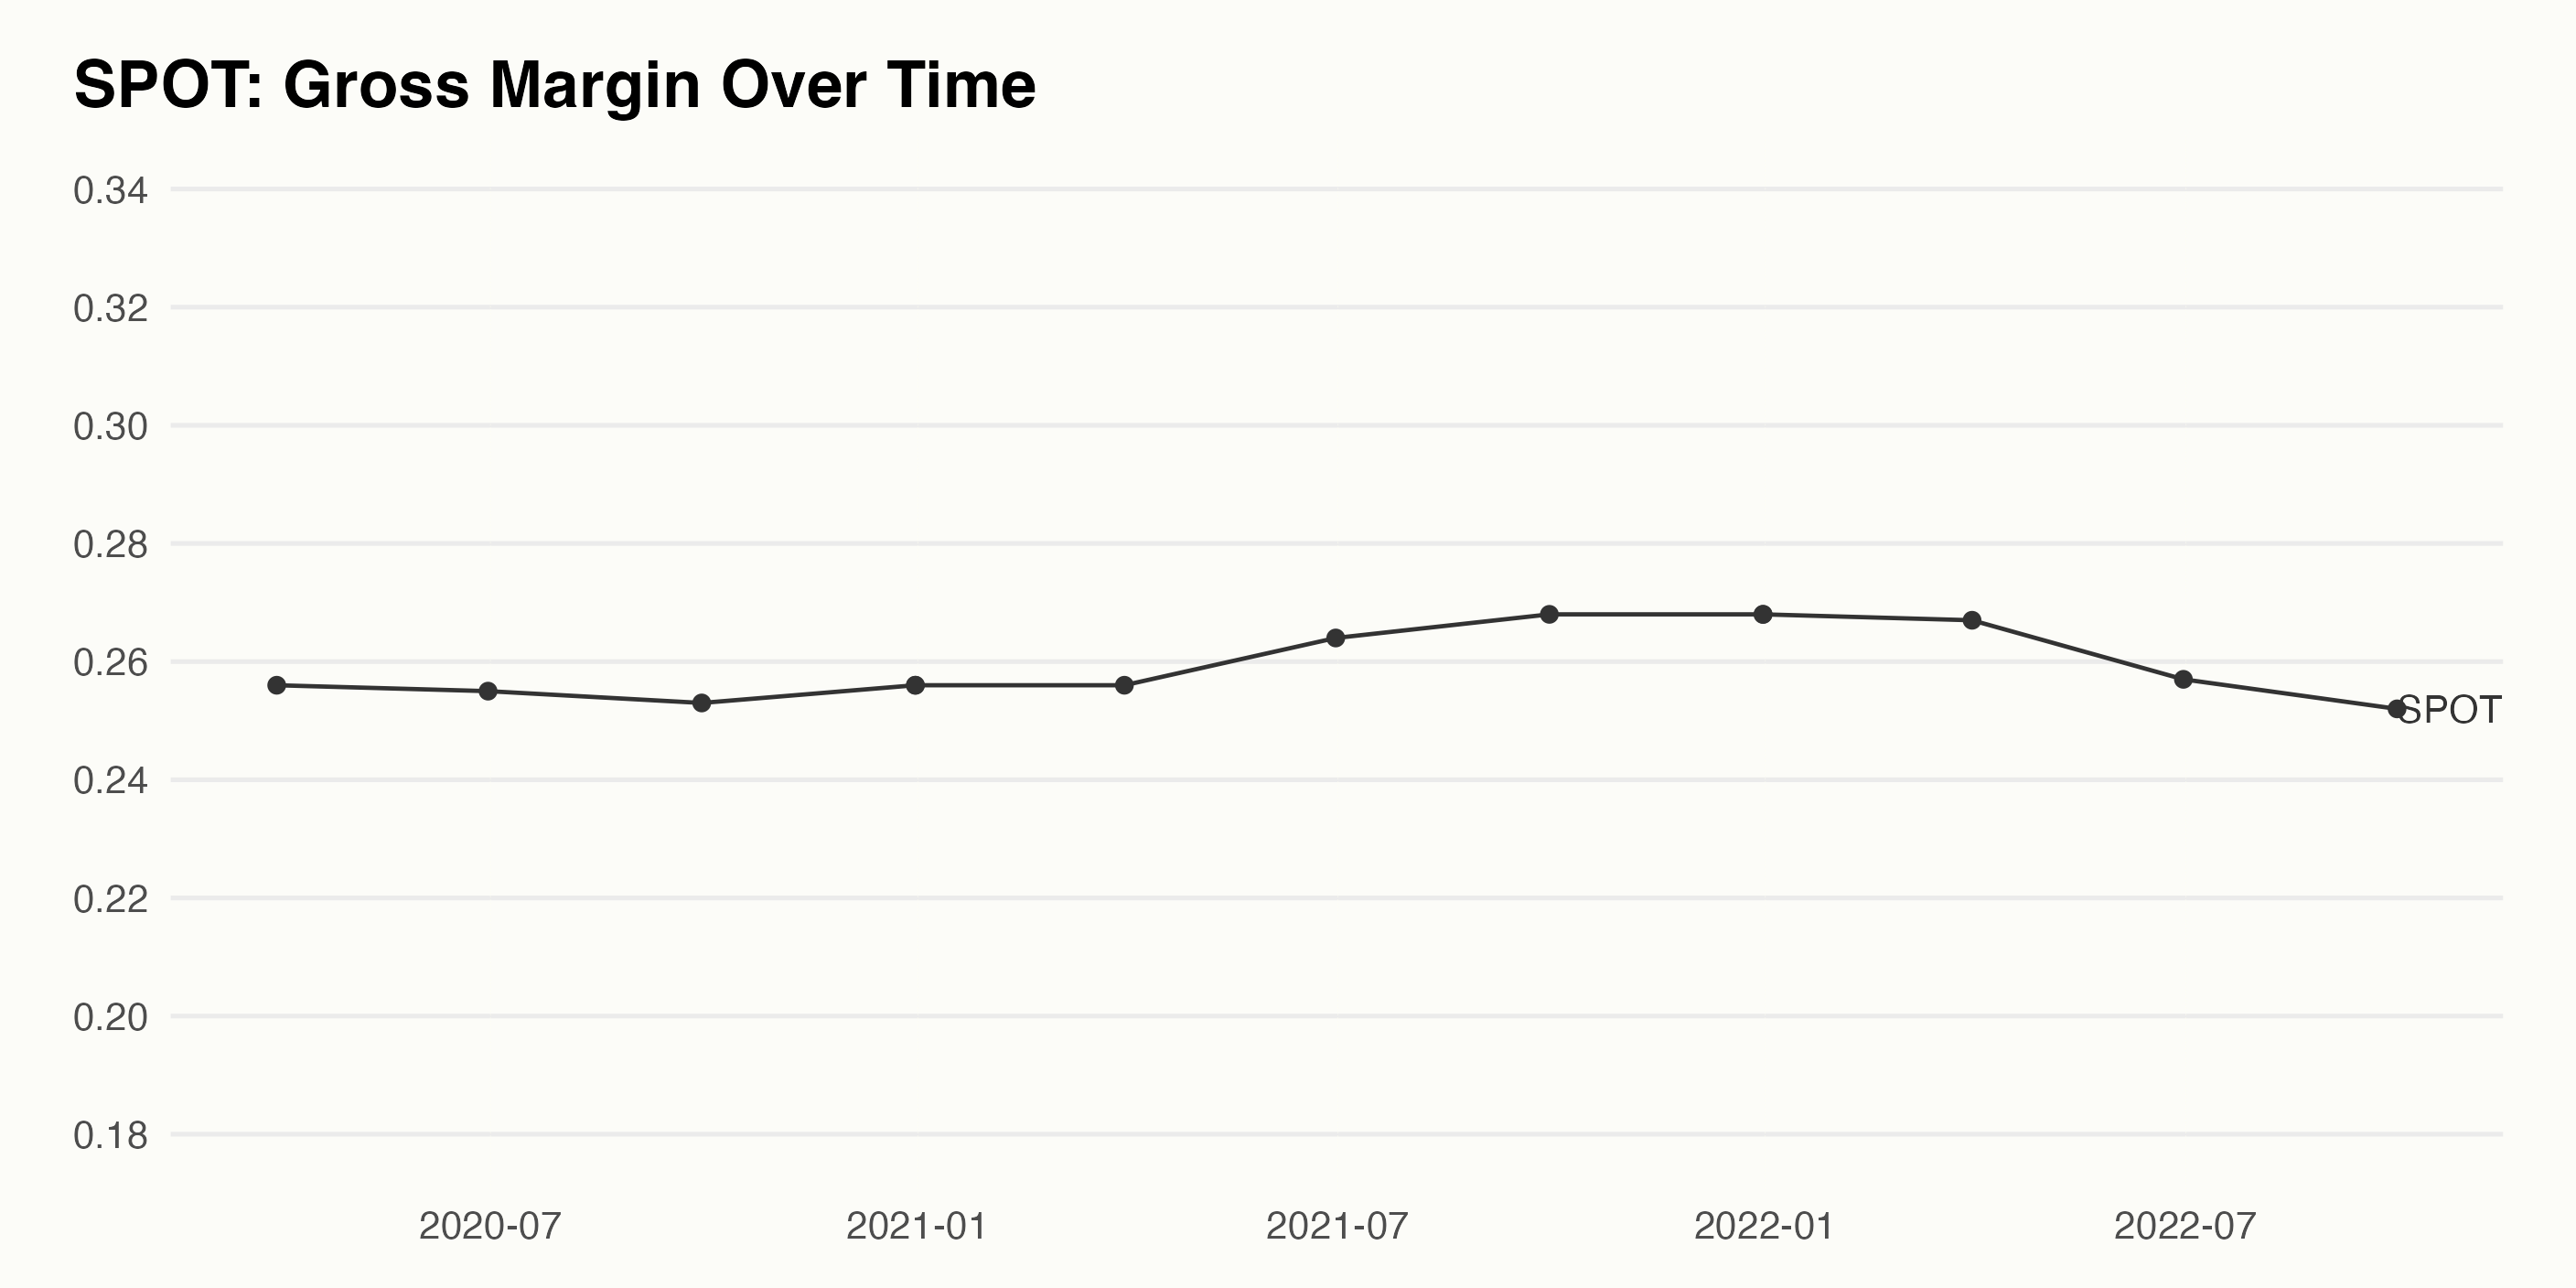
The gross margin of SPOT has held fairly constant across the past 18 months, centered near 25%. Since March of 2020, there has been a slight decrease amounting to about 1.61%. More recently, the company reported a gross margin of 26.7% for March 2022, but has dropped slightly to 25.2% in September 2022, perhaps a reflection of intensifying economic pressures and a looming recession.
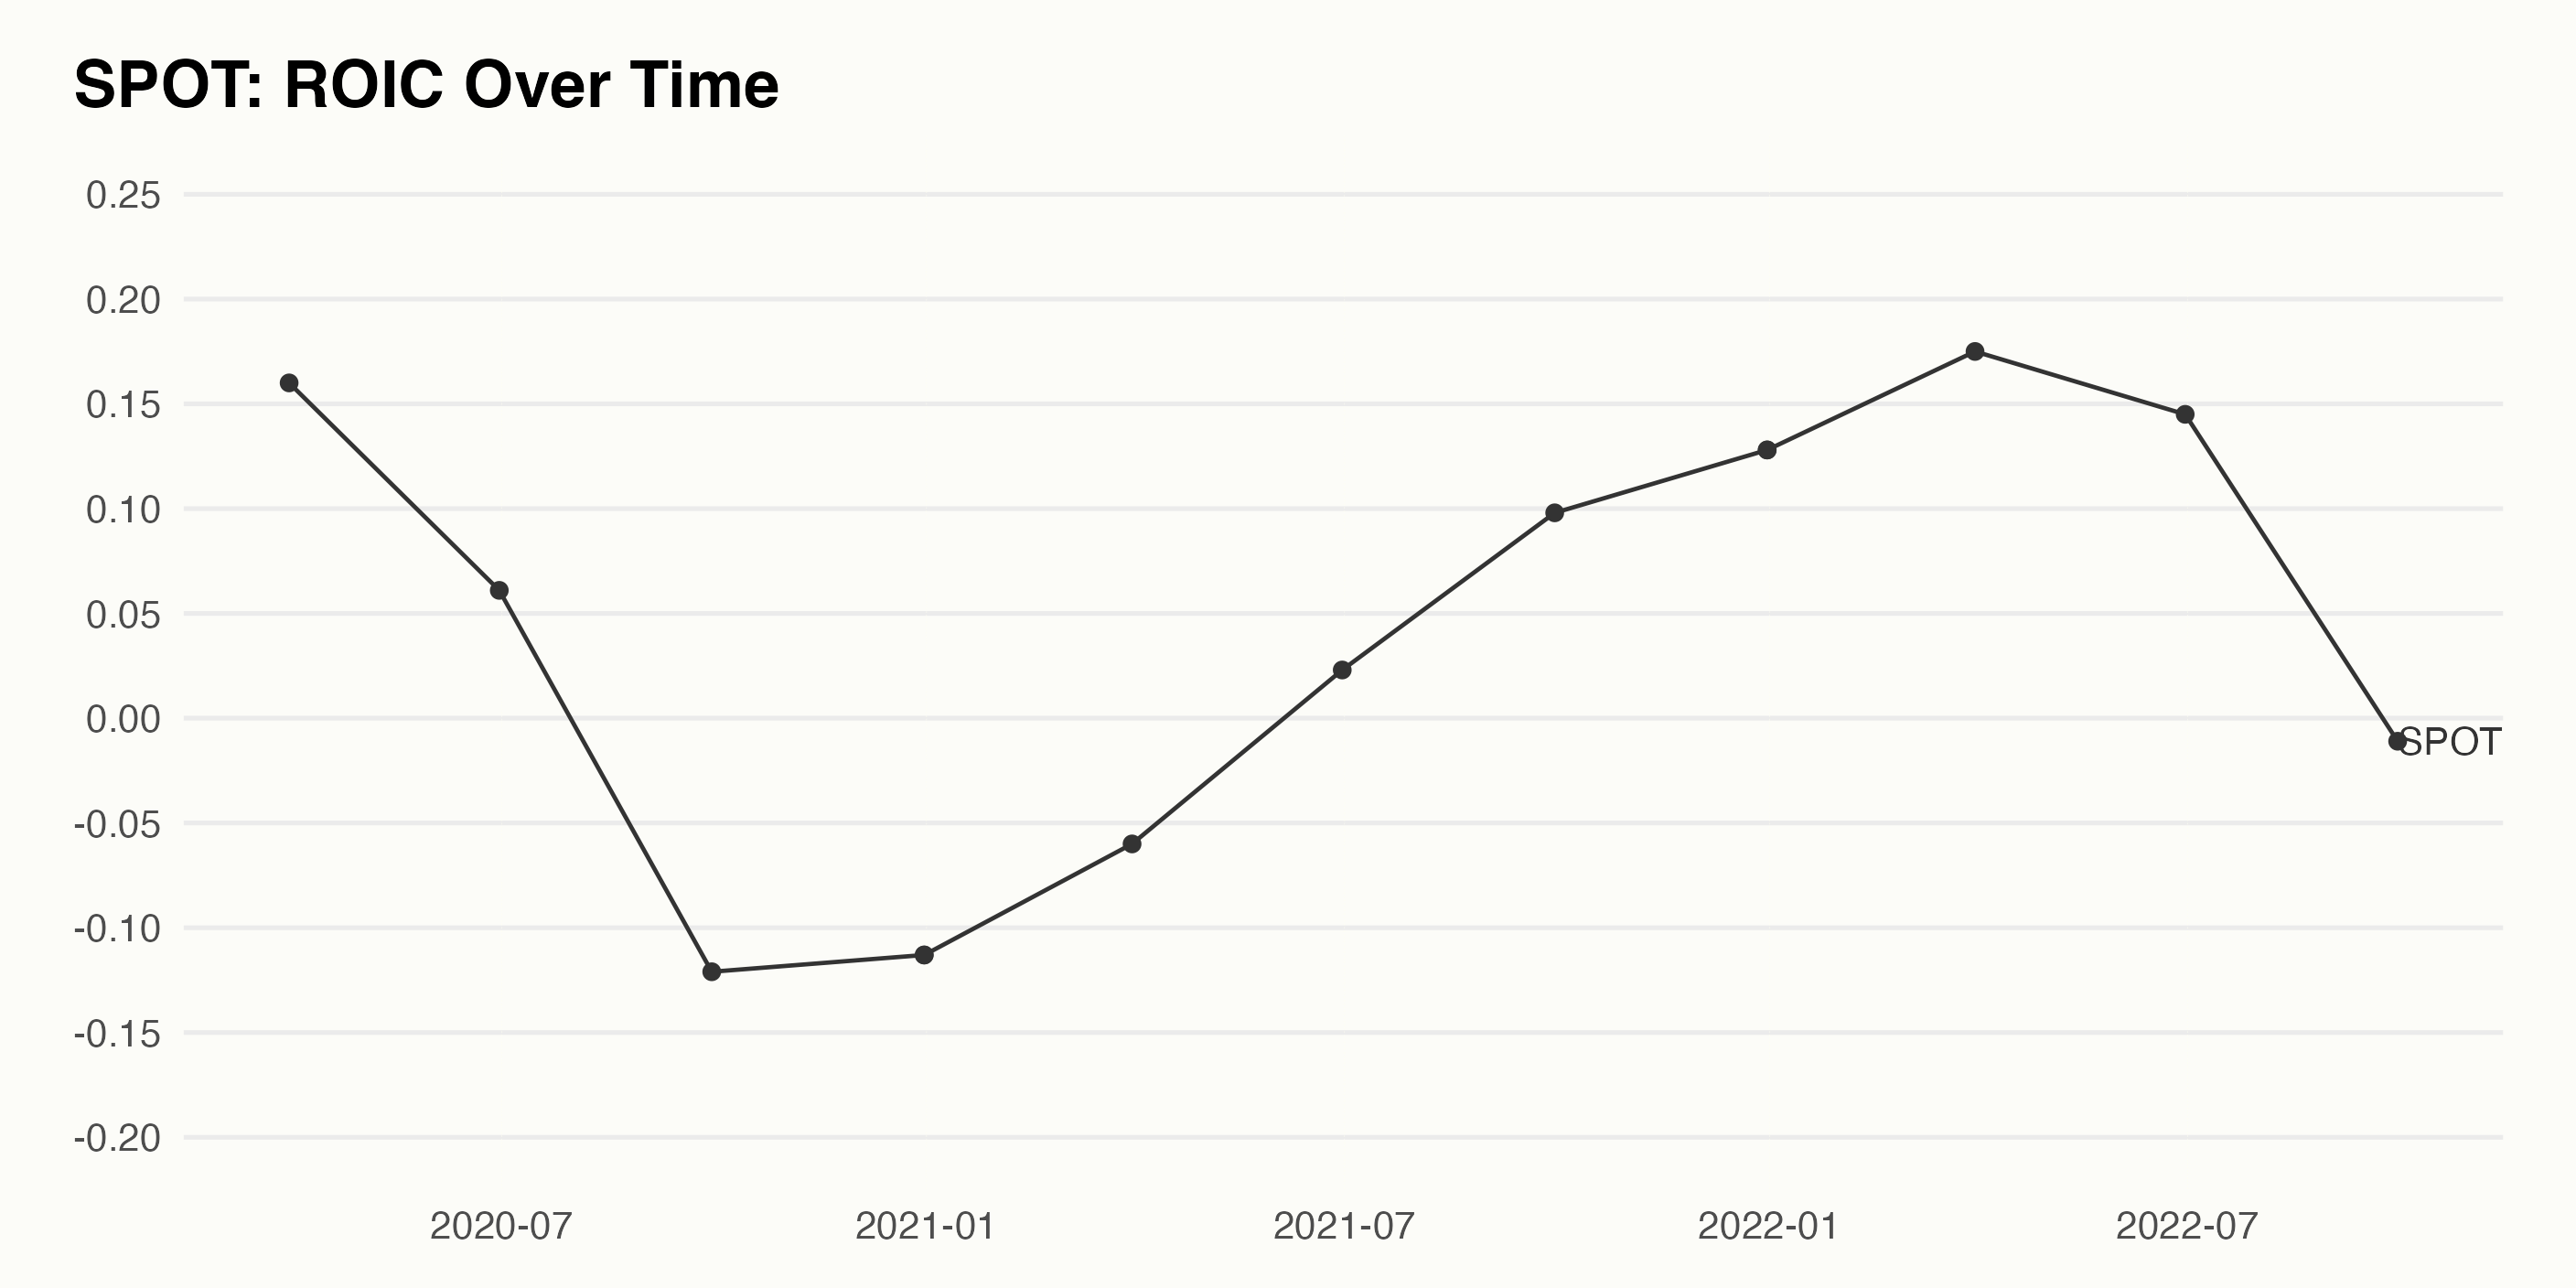
The reported return on invested capital (ROIC) of SPOT has fluctuated over the past two-and-a-half years, with an overall growth rate of 10.6 percent. In March 2020, the ROIC was 16%, before dropping sharply to -12% by December 2020. After climbing to -6% in March 2021, it once again increased and rose to 18% in March 2022. Now, though, it is once again negative, with its most recent value for September 2022 coming in at -1.1%.
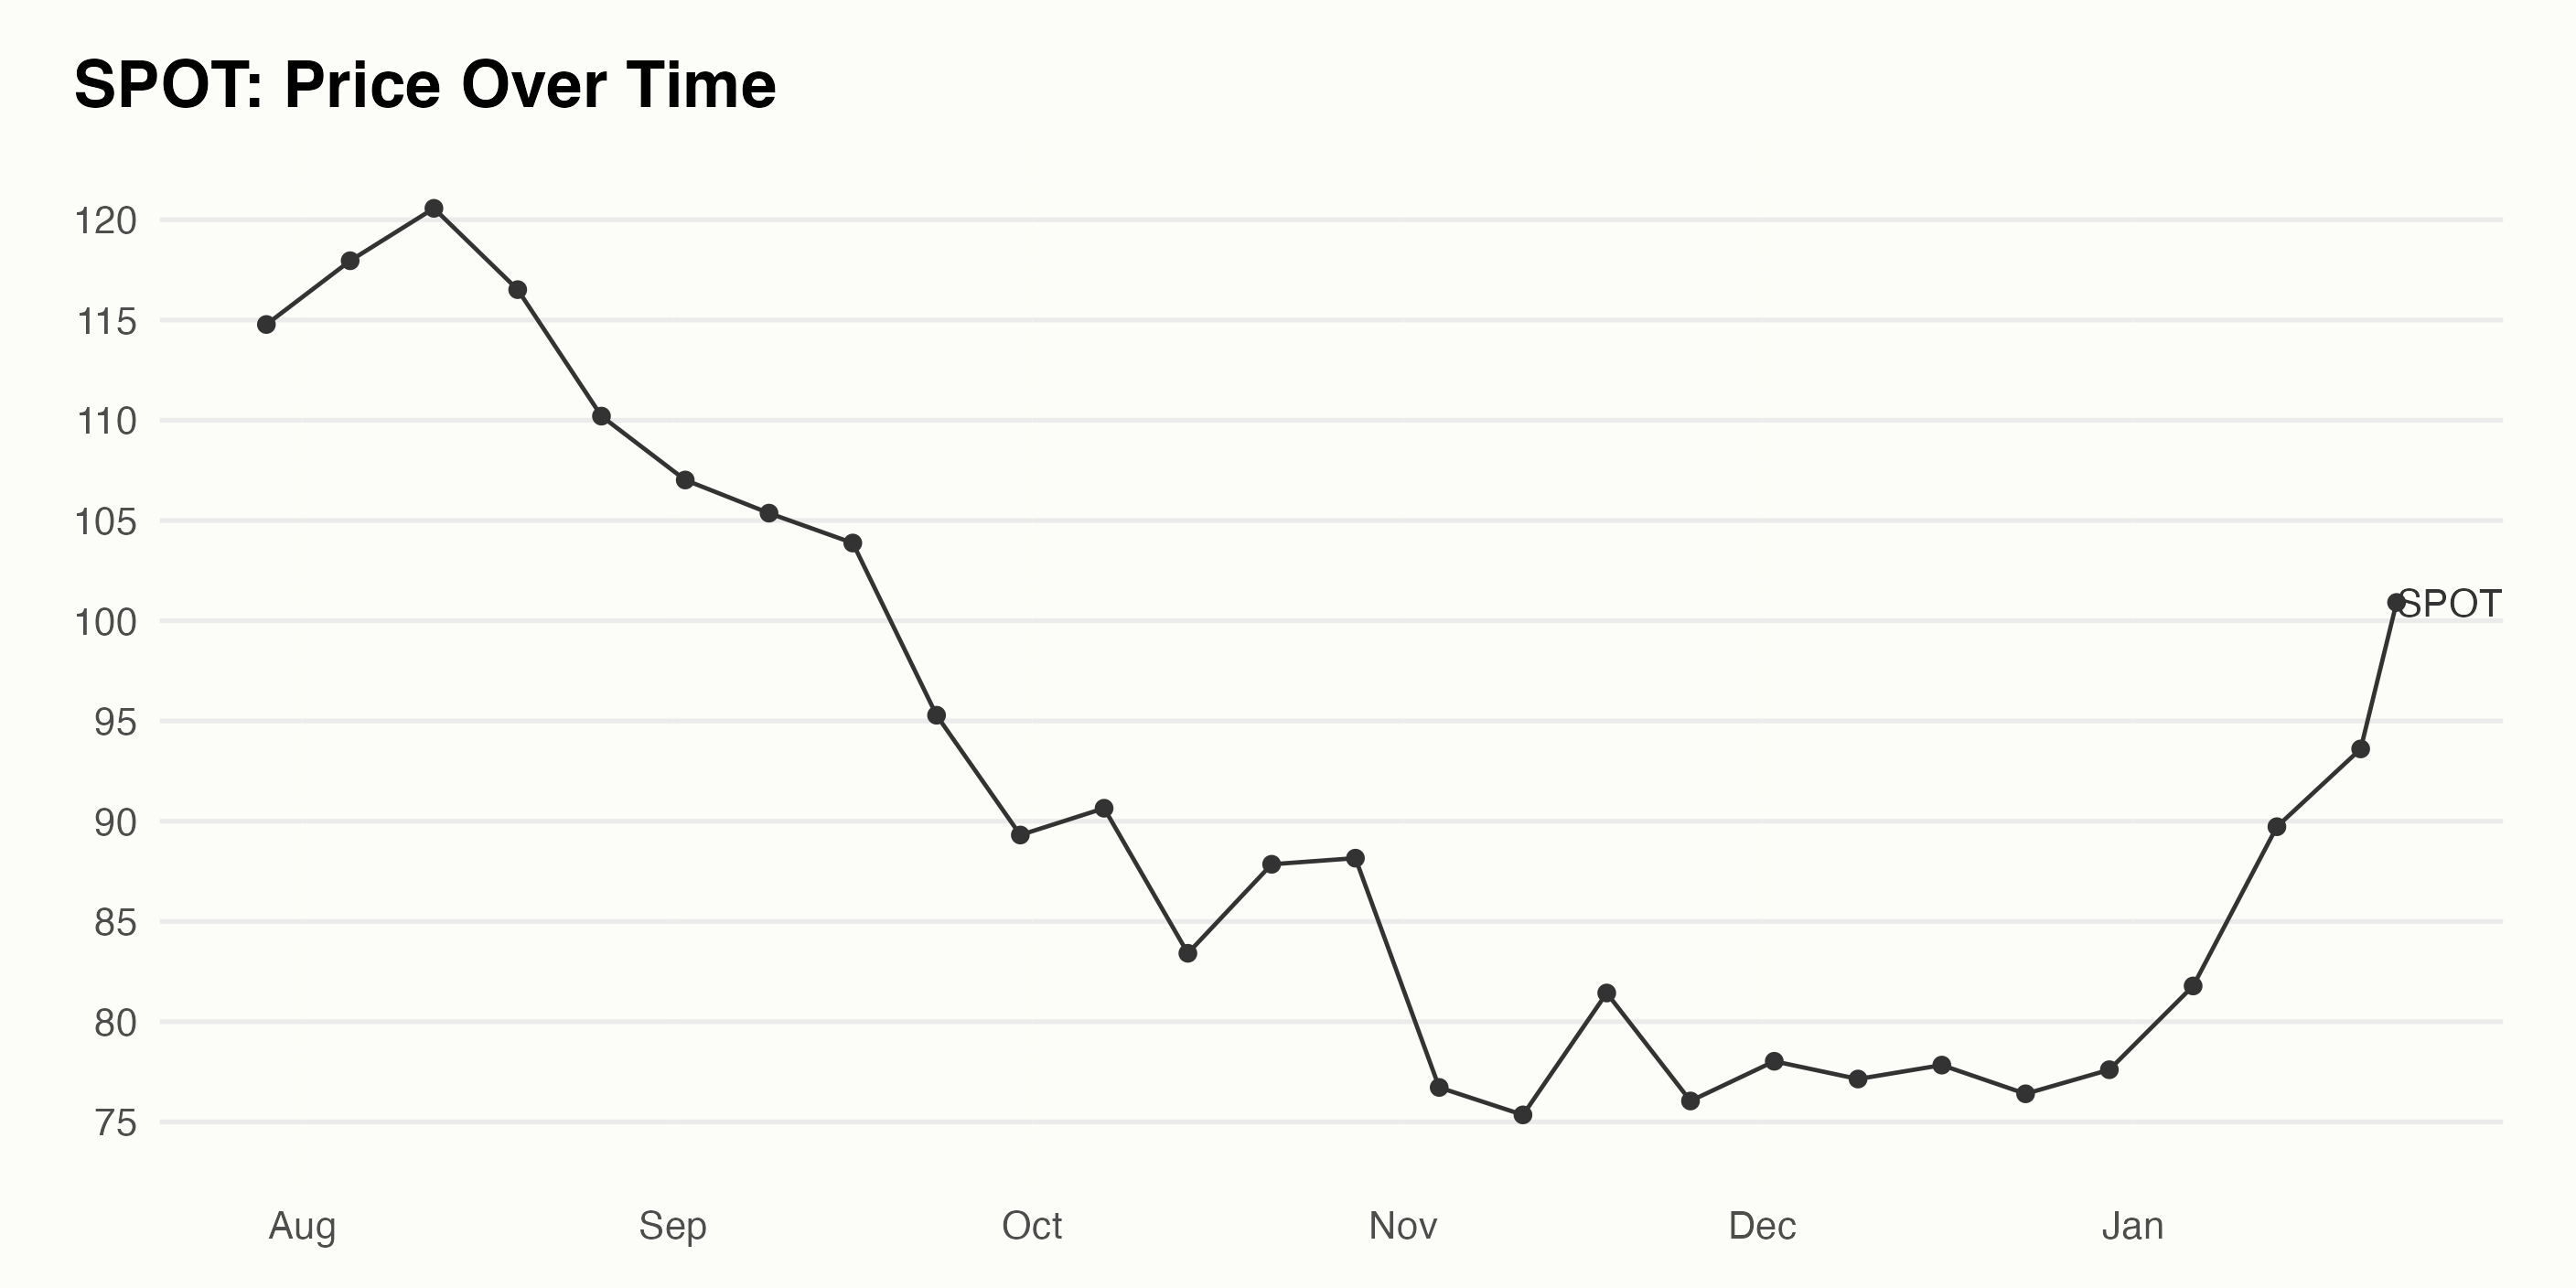
The Fluctuating Share Price of SPOT from July 29, 2022 to January 23, 2023
The trend of the data show an initial increase from $114.77 to $120.57 from July 29, 2022 to Aug 12, 2022. After this, the share price rises and falls for the next 4 weeks before dropping considerably and remaining relatively flat for the following 3 weeks, ranging from $75.35 to $81.43 from Nov 11, 2022 to Nov 18, 2022. The trend then shows an accelerating increase, with the share price moving from $76.04 to $93.61 from Nov 25, 2022 to Jan 20, 2023. The share price significantly increases, to $100.91 on Jan 23, 2023. Momentum may be positive, but with negative ROIC and gross margins below what software companies typically generate, investors may wish to think carefully about SPOT before entering a long position at this time.
 *
*
Want More Great Investing Ideas?
shares were trading at $400.52 per share on Monday afternoon, up $4.64 (+1.17%). Year-to-date, has gained 4.73%, versus a % rise in the benchmark S&P 500 index during the same period.
About the Author: Simit Patel

Simit Patel has 2 decades of investing experience applying a top-down approach starting with macroeconomics followed by price action technical analysis to find more winning trades. More...


