
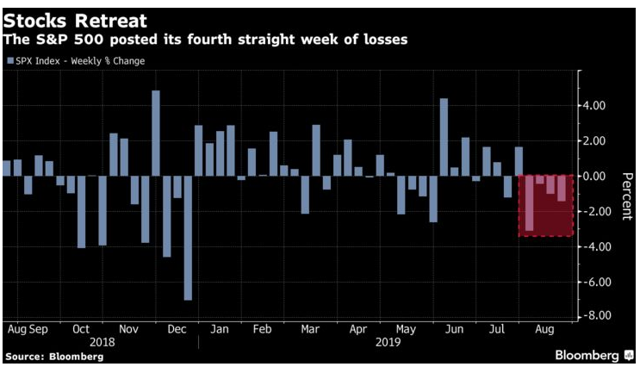
It’s been a painful month for stocks with the S&P 500 now posting its fourth straight week of losses.
Trade war and Fed policy uncertainty have many worried that a recession is looming over us, and with it, a potential bear market. And with horrifying memories of the 2007 to 2009 Great Recession and the stock market being cut in half still fresh in many people’s minds, the worry about such a downturn is making many understandably nervous.
So here are the three reasons why I’m not at all worried about a recession, nor allowing it to change how I manage my retirement portfolio or any of the four Dividend Kings’ model portfolios.
Reason One: 12-Month Recession Risk Is Currently 43% to 47%
I maintain a real-time 12-month recession risk model based on the one from the Cleveland Fed/Haver Analytics.
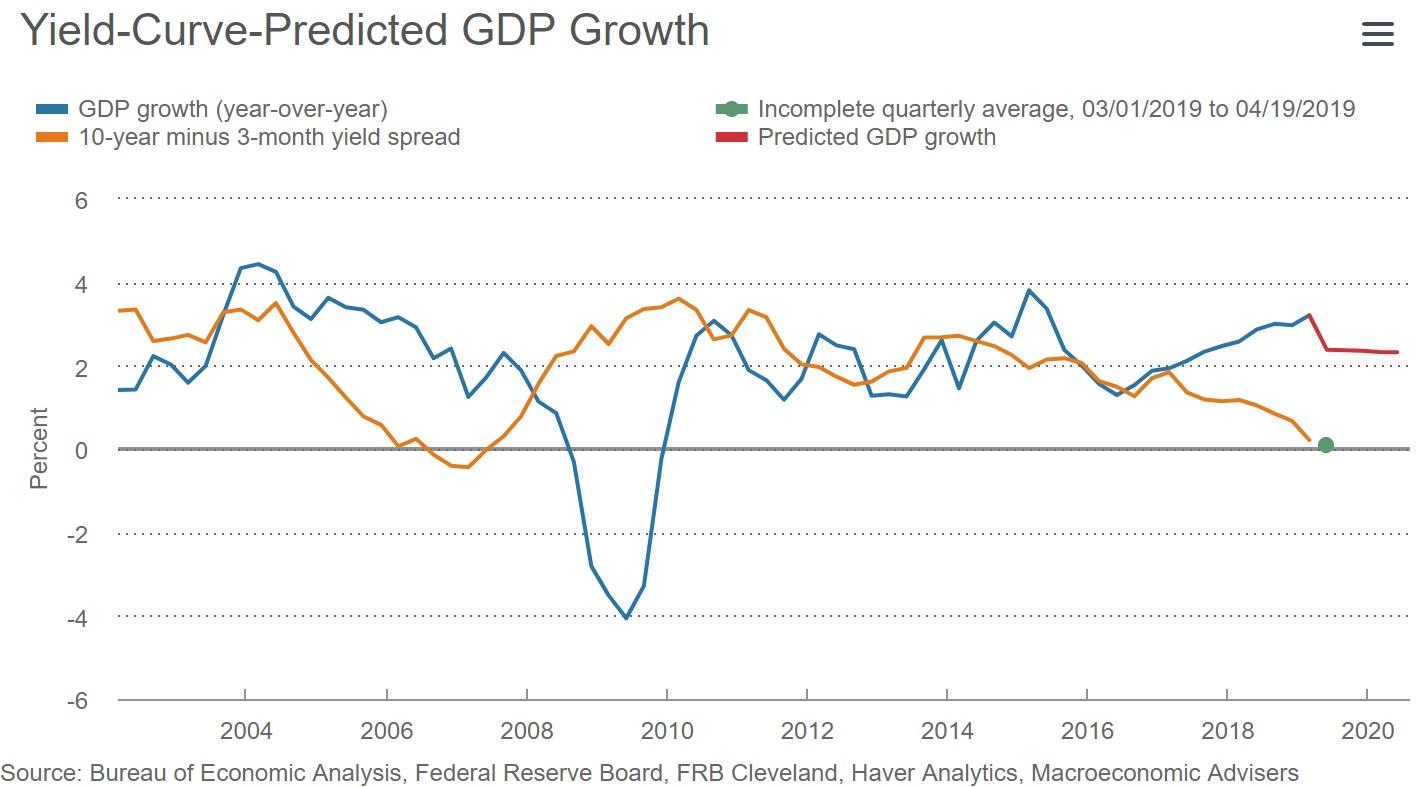
While no economic model is perfect, this one, which is primarily driven by the 10y-3m yield curve, is relatively accurate at estimating short-term economic growth, and more importantly, 12-month recession risk.
(Source: Cleveland Federal Reserve)
The Cleveland Fed’s model is updated once per month (next update August 29th). It uses the average of the 10y-3m yield curve to estimate how fast the economy is growing this year and how likely a downturn will begin within a year.
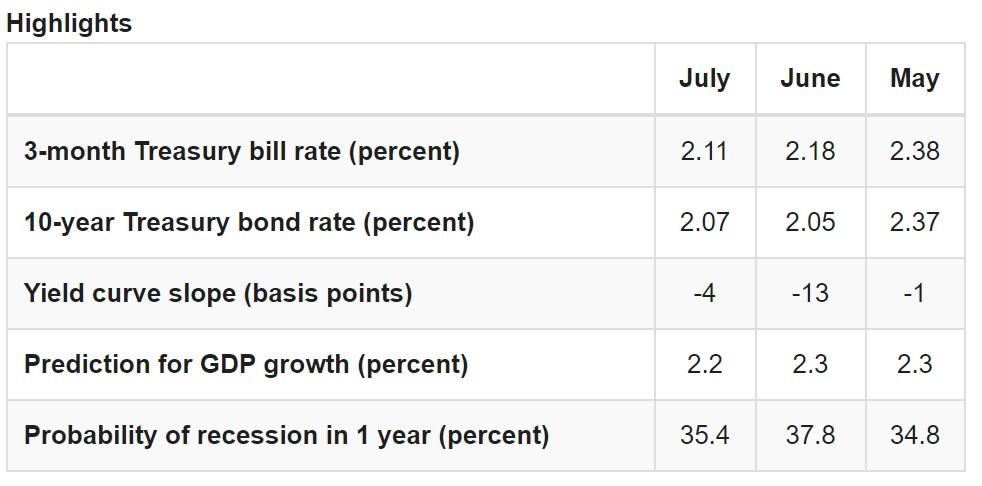
What I do with my model is to use the last three months worth of yield curve vs recession risk data to calculate how much recession risk falls/rises per each basis point of yield curve inversion. Over the last three months, the slope of the curve has indicated 0.2% to 0.27% recession risk sensitivity to the curve.
We can then look at the current curve (-45 basis points inverted) and subtract four from that, to estimate that recession risk today (if the current inversion persisted for an entire month) would be 8.2% to 11.1% higher than the Cleveland Fed’s July estimate of 35.4%.
Or to put another way, if all conditions we face today, were to remain the same for a month, then 12-month recession risk would be about 43% to 47%. Mark Zandi, chief economist of Moody’s told CNBC on Friday, August 23rd that Moody’s proprietary economic model estimates 12-month recession risk at 45%.
That’s a nice confirmation that my approach, which also lines up with various estimates of 33% to 55% recession risk (Jeff Miller’s 9-month meta-analysis estimate is 45%) offers a reasonable estimate.
Here’s Moody’s Mark Zandi explaining how the current trade war is bringing us close to the tipping point where recession becomes the more probable outcome.
Chinese retaliation clearly shows they are making no progress on negotiations for a deal, and the president just upped the ante again. They are firing at each other without any restraint at this point. Recession odds are a lot higher. He’s about to push the economy off the rails. It’s very close.“
But 45% recession risk means that there is a 55% chance we avoid recession, instead of achieving 2016 style (1.6% growth that year) growth rate next year.
Reason Two: A Trade War Is Likely to Slow Growth, Not Trigger a Recession or Bear Market
Economic models are useful but ultimately all investors need to remember they merely predict what will happen with fundamentals (the facts) based on current risks.
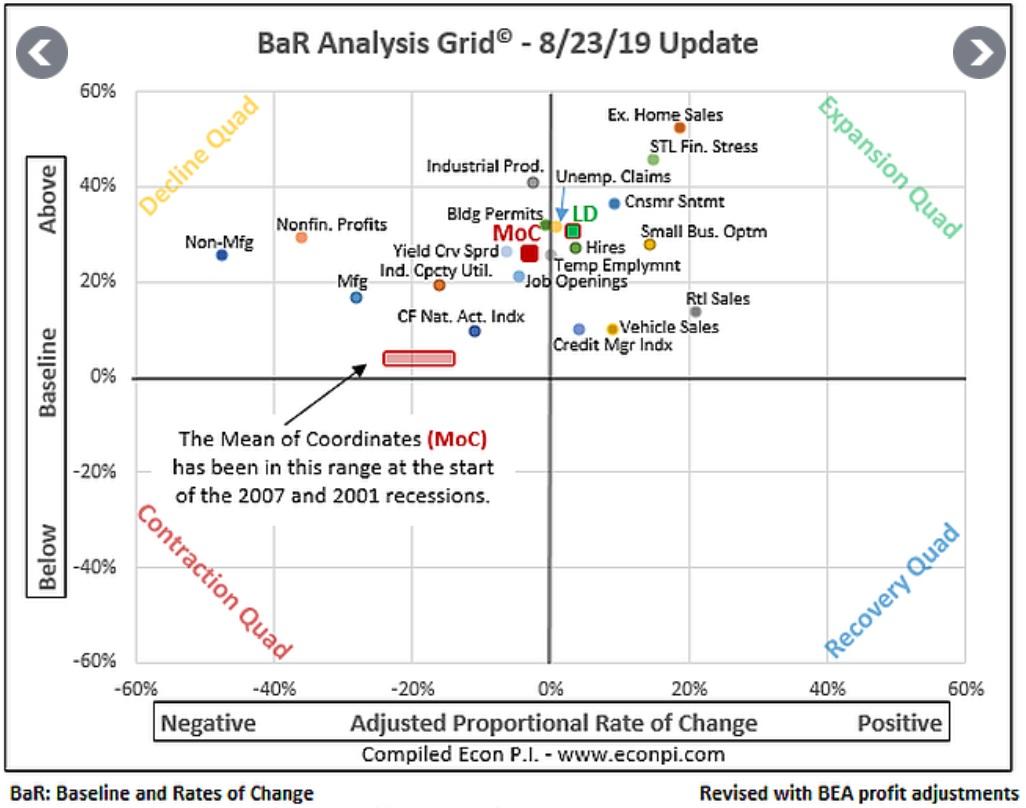
(Source: David Rice)
This is my favorite tool to use to track actual economic data, created and maintained on a weekly basis by David Rice. It measures 19 leading economic indicators, both how much each is above historical baseline, as well as how rapidly they are growing or shrinking.
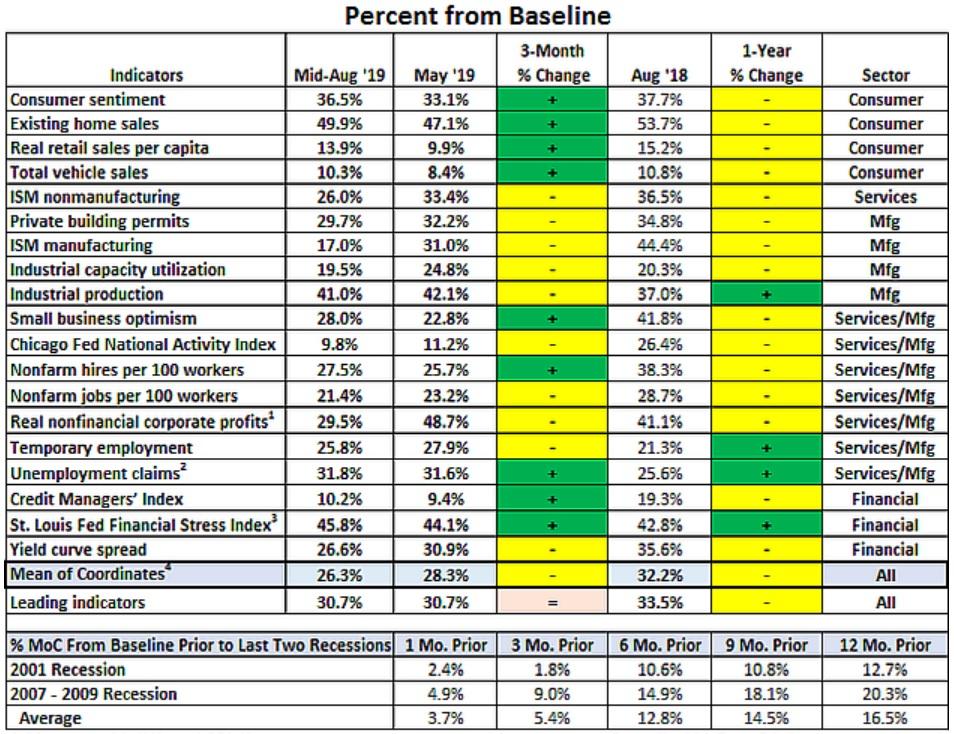
The mean of coordinates or MoC is the average of each indicator and provides the best single number to objectively estimate the health of the US economy. The LD (green dot) represents the eight most sensitive indicators (10y-3m curve is one of them) that change most rapidly and predict, based on the most recent three months, where the average of all the indicators is headed if current conditions persist.
As of August 16th (the stats table is updated every other week), the average of all the indicators was 26.3% above historical baseline, the eight most sensitive indicators (canaries in the coal mine) was 30.3% above baseline.
Mr. Rice has been kind enough to crunch the numbers to provide us with the bottom table, showing how the MoC was tracking in periods prior to the last two recessions. Those recessions were the mildest since WWII (2001) and the most severe (2007-2009).
As long as the average of all the leading indicators is 20+% above historical baseline we’re very unlikely to be in a recession right now, but also likely a year or more away from the start of a contraction.
In early July the MoC was 29% above baseline and Mr. Rice estimated it would take about 18 months for conditions to deteriorate to recessionary conditions, assuming we got a recession at all. This means if the current rate of decline continues, we’re about 17 months away from recession. Remember the Fed can cut rates eight more times, which Moody’s estimates would boost GDP growth by about 1% within a year.
The trade war could also end (literally via tweet) which would eliminate the single biggest recession risk we have right now (other than fears of recession creating a self-fulfilling prophecy of falling consumer spending and business investment).
But whether or not we get a recession in 2020 or 2021, one will arrive eventually. And even when that happens, I still won’t lose sleep over it.
Reason Three: Even If We Get a Recession It’s Likely to Be Mild and Nothing Like the Financial Crisis Meltdown
During the Great Recession, GDP fell by about 5%, more than double the average recessionary growth decline. Unemployment doubled to 10% and millions of jobs and homes were lost ($13 trillion in stock market wealth wiped out as well, at least temporarily).
But guess what? 2007-2009 was NOTHING like the typical post-WWII recession of which there have been seven per the National Bureau of Economic Research. That’s the government agency in charge of monitoring the economy and officially declaring recessions.
All US Recessions Since 1854
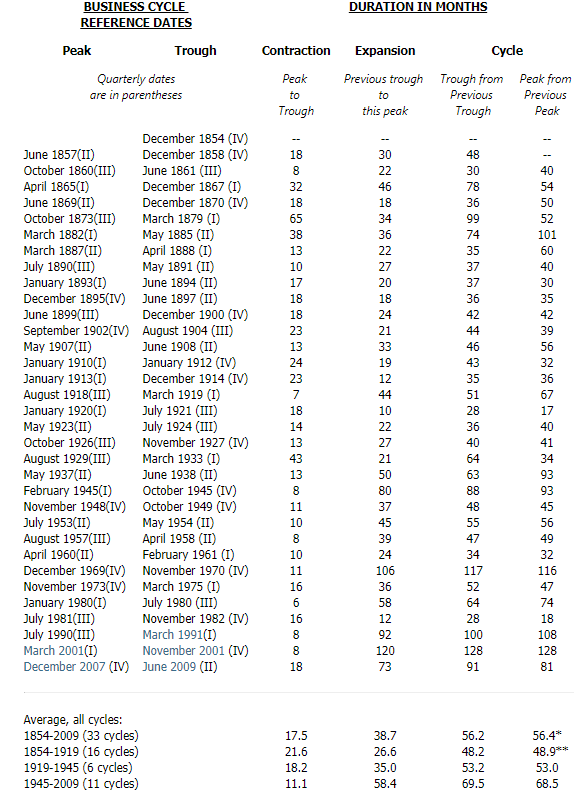
(Source: National Bureau of Economic Research)
Since WWII recessions have been less frequent, shorter (averaging just 11.1 months in duration) and far milder than the disastrous panics and depressions of the late 19th and early 20th century.
The duration of modern recessions ranges from 6 months (1980) to 18 months (2007 to 2009).
- average peak GDP decline 1.4% (4% in 2007-2009, triple the average, including the Great Recession itself)
- stocks average a 30% peak decline (14 month decline period), 11-month 26% decline excluding the 2000 tech bubble and 2007 Financial Crisis
- unemployment goes up for 15 to 16 months, on average 2.4% (so 6% peak unemployment based on 3.6% low this cycle)
Most importantly for long-term income investors, the average US company (per the S&P 500) cuts their dividends just 2% during typical recessions.

I’ve calibrated my 11 point quality score for dividend stocks around this fact, with level 7/11 being represented by average dividend safety, average business model risk, and average quality management.
With few exceptions, my company recommendations are all level eight quality (above average) or higher, and my retirement portfolio average weighting is about nine (blue chip quality). Dividend King Portfolio are also averaging level 9 or 9.6 quality (average dividend aristocrat and king is 9.6 as well).
The companies I own now, raised their dividends at 10% CAGR during the financial crisis, which is why I don’t fear for the $16,200 in annual dividend income my portfolio is throwing off (10% growth over the past decade and long-term sustainable rate about 7%).
50/50 Stock/Bond Portfolio Total Returns Since 1987
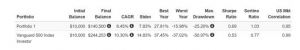
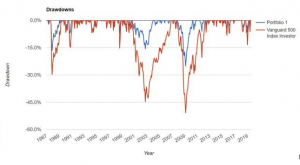
(Source: Portfolio Visualizer)
And ultimately a well-constructed portfolio, with proper asset allocation for your needs, is capable of withstanding even the most ferocious of bear markets (like 2007-2009).
For example, here’s a 50/50 stock/bond portfolio which declined half as much during the Great Recession.

(Source: Portfolio Visualizer)
This portfolio declined by about half as much during every major period of stock market fear since 1987. The bonds appreciated in valued (negative correlation to stocks) giving retirees something to sell rather than stocks, during bear markets.
Add in safe and growing dividends over time, which can be spent first to preserve your bond allocation, and you can easily ride out even long bear markets (since WWII average bear market lasts three years, from market high to market high).
The point is that as long as you have your financial house in order, you need not fear inevitable but unpredictable recessions.
SPY shares were trading at $286.75 per share on Tuesday afternoon, down $1.25 (-0.43%). Year-to-date, SPY has gained 15.80%, versus a % rise in the benchmark S&P 500 index during the same period.
About the Author: Adam Galas

Adam has spent years as a writer for The Motley Fool, Simply Safe Dividends, Seeking Alpha, and Dividend Sensei. His goal is to help people learn how to harness the power of dividend growth investing. Learn more about Adam’s background, along with links to his most recent articles. More...
More Resources for the Stocks in this Article
| Ticker | POWR Rating | Industry Rank | Rank in Industry |
| SPY | Get Rating | Get Rating | Get Rating |


