

It’s been a red hot year for stocks, with the S&P 500 is up over 31% YTD and it could end up having the best year since 1995.
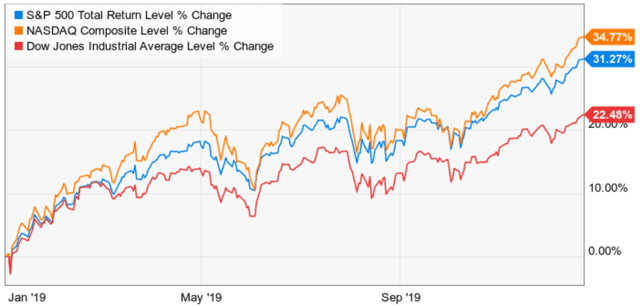
(Source: Ycharts)
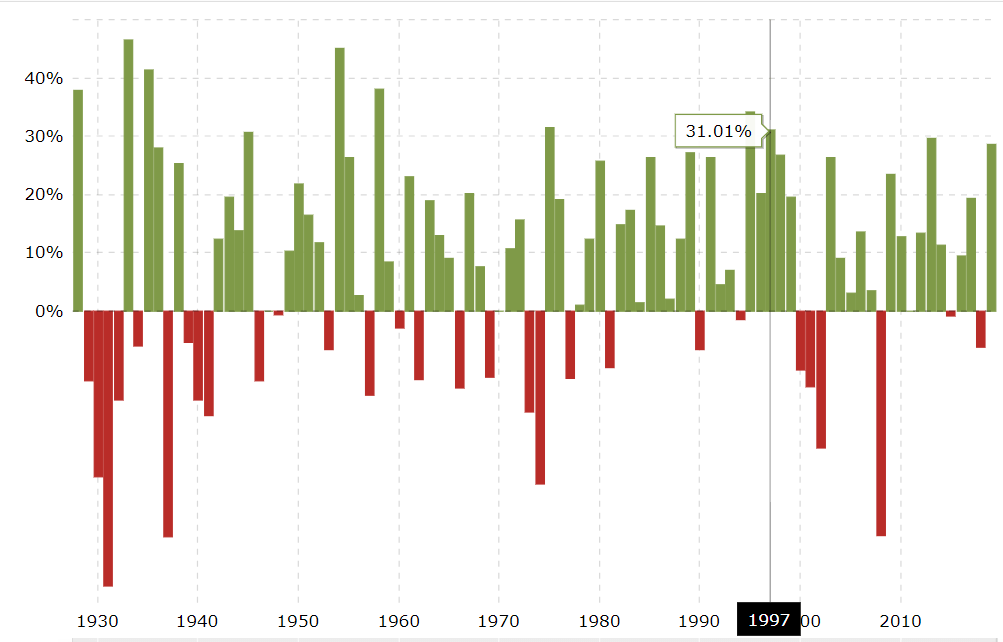
(Source: Macrotrends)
Naturally many fear that a big correction might be coming soon, so here are three factors investors need to know about 2020, and what they can likely expect from stocks next year.
Stocks Are Likely To Go Up…But Not Nearly As Much
The good news is that stocks go up most years. In fact, since 1871 stocks have gone up 69% of years.

(Source: Lance Roberts)
Since 1926 the average gain has been 11.9% for all years, and years following double-digit gains have averaged only slightly less.
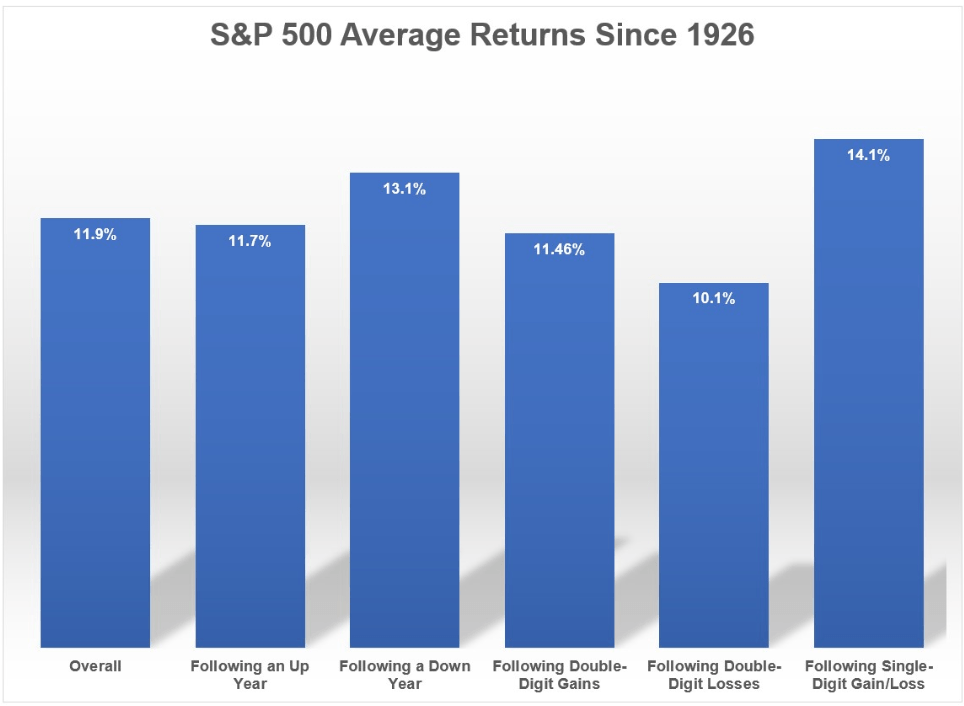
(Source: Ben Carlson)
However, when it comes to 2020 I’m expecting -11% to 7% gains for the broader market and here’s why.
(Source: Trinity Asset Management)
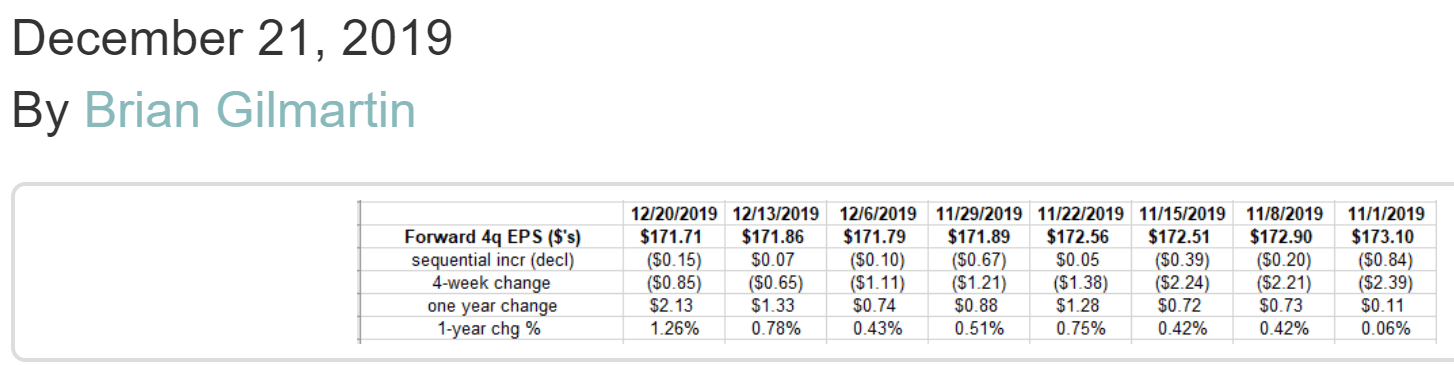
While economic news has been better than expected in recent weeks (1.7% to 2.1% economic growth now likely in 2020), earnings growth forecasts have not been going up. In fact, they’ve stabilized but have yet to start climbing to the 9.6% consensus growth that FactSet is reporting.
- 20-year average analyst overestimate for 12-month earnings: 6.8%
- 20-year average overestimate for non-recessionary years: 1.8%
FactSet’s 9.6% consensus estimate for EPS growth next year is the most bullish I’ve seen and adjusting for that average overestimate in non-recessionary years I expect no more than 8% EPS growth next year.
5% to 7% is the historical average and both Goldman Sachs and Wells Fargo are expecting 5% growth next year. Thus 5% to 8% EPS growth is likely in 2020.
The phase one trade deal will help boost economic growth (0.2% to 0.3% according to Goldman and Jeff Miller, respectively) but the tightest job market in 50 years means margin pressure is likely to persist.
Even if we got a full phase three trade deal, which would significantly boost industrial margins from an end to tariffs, wage pressure would likely become the major growth headwind for corporate America.
Today wage growth is 3.1% with 3.7% among non-supervisors (80% of workers). Goldman’s forecast for 2020 is for 3.3% unemployment by the end of the year and 3.5% wage growth (possibly 4% for non-supervisory workers). It would take just 150,000 average net monthly jobs in 2020 for us to hit 3.2% unemployment and beat those expectations. 180K per month is the 2019 average and in the last three months, we’ve averaged 205K.
With the S&P 500 now trading at forward PE of 18.6, that means the broader market is 16% historically overvalued. If the market were to trade purely on fundamentals then an 11% decline next year would bring the S&P 500 down to its 25 year average 16.24 forward PE.
Of course, valuations don’t tell us what the market will do over the short-term, just what long-term returns are likely to be.
- valuations explain 10% of 12-month total returns
- valuations explain 46% of 5-year total returns
- valuations explain 90% of 10+ year total returns
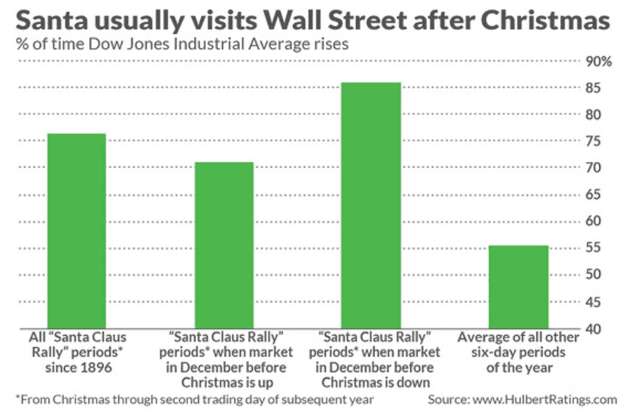
The market is likely to get its Santa rally, which is when stocks historically rise 0.75% to 1.5% in the six trading days following Christmas. However, that merely means that valuations are likely to get even more stretched and puts us at high risk of an early 2020 pullback/correction.
A Pullback/Correction Is Highly Likely Next Year
Chris Harvey, Wells Fargo Chief Equity Strategist, just wrote in a note explaining
The last time sentiment felt this positive (4Q17, on the heels of tax reform) stocks initially rallied in 1Q18 before running head-first into a 10% correction… A 10% stock market correction in 1H20 is possible; we can envision one in late March/early April when the Fed’s balance sheet possibly stops growing…If we do see a healthy equity sell-off in 1H20, we would buy weakness, all else equal.”
A 5% to 9.9% pullback is almost certain in 2020, barring another 2017 style meltup which would make a future correction (in 2021) more severe.
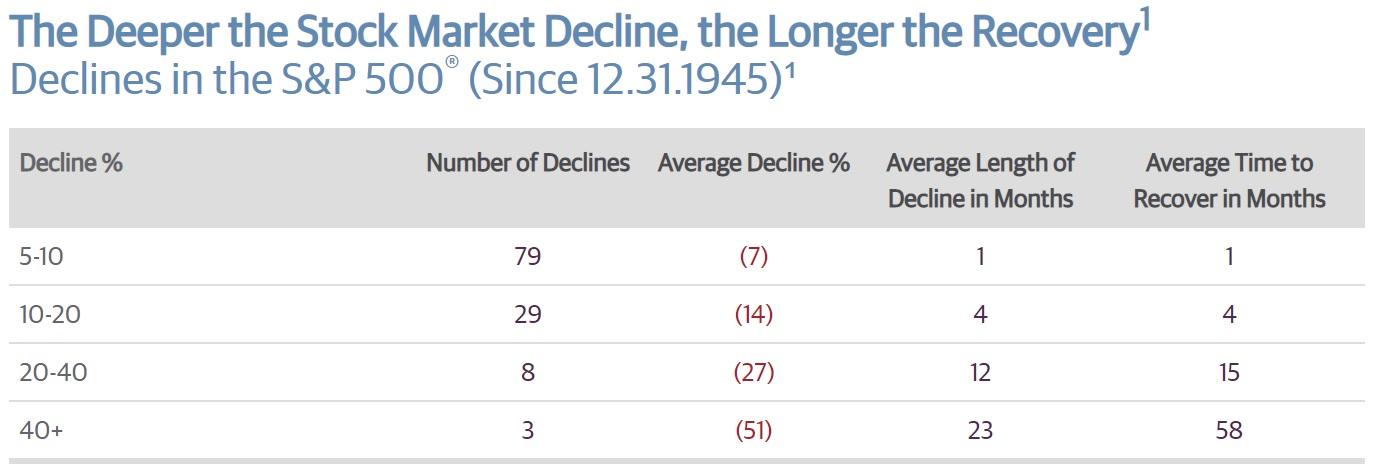
(Source: Guggenheim, Ned Davis Research)
Since 1945 (and 2009) we’ve averaged a 5+% pullback or correction every six months. Given when the last one ended, another one is historically likely by May 2020.
Bank of America’s quantitative model, using fund flow data from Lipper Financial, thinks that stocks could peak in March at 3,333 or about 4% higher than today. Bank of America expects the S&P 500 to end 2020 at 3,300, meaning following a meltup through March, stocks would trade flat for the rest of the year.
I’m not a technical analyst nor a market timer. What I do know is that 2019’s rally occurred despite a record amount of outflows as retail investors sold stocks to put the money into bonds.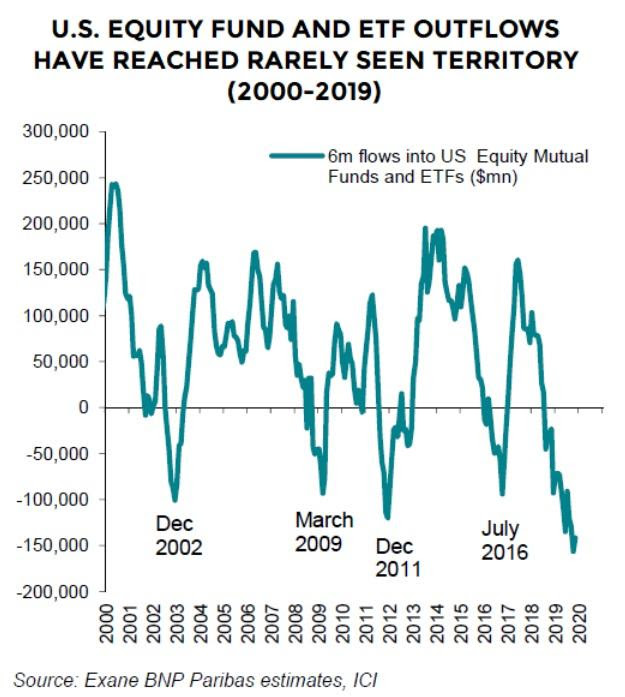
We don’t have much historical data about periods following such extreme outflows, but what we do have points to a melt-up being possible.

Lipper Financial is reporting that fund inflows have resumed, though they are rather modest for now. But that means that Q4 is the first quarter in which retail investors are putting money back into stocks, likely chasing performance out of a “fear of missing out.”
That’s what happened in Q4 2017 after the market went up 14 consecutive months and the peak decline was just 2.7%. That was the lowest volatility since 1952 and created a large amount of complacency among investors who foolishly started to believe stocks could only go up.
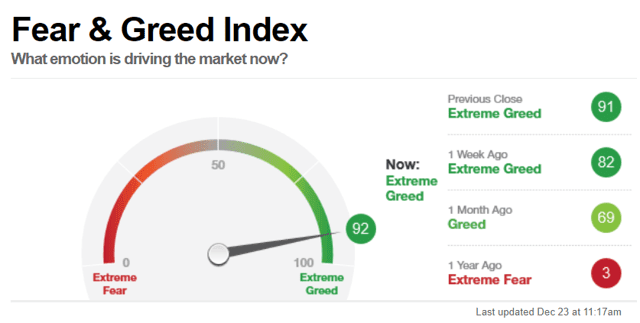
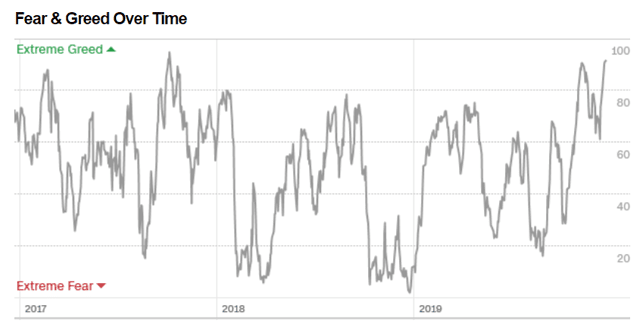
(Source: CNN)
What a difference a year makes. In December 2008 CNN’s fear and greed index (created from seven technical indicators) was at three. Today it’s 92 one of the highest levels ever recorded.
Remember that valuation and sentiment (other sentiment indicators also point to greed though not nearly as much as CNN’s index) CAN NOT be used to time the market.
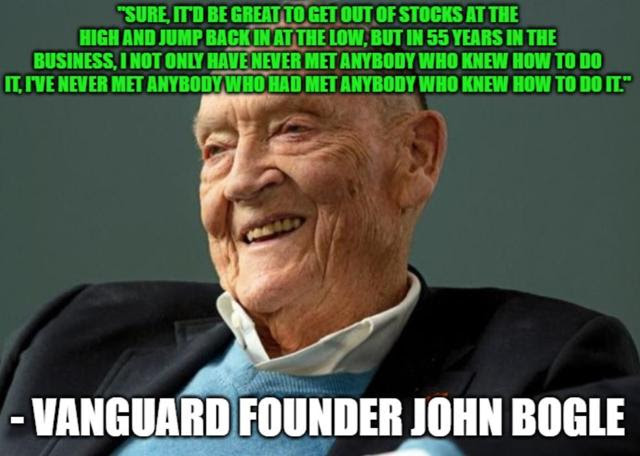
(Source: imgflip)
All it can tell us is that pullback/correction risk is very elevated and that the market is priced for perfection due to investors misconstruing lower economic risk for no risk.
Trade Talks or Inflation Concerns Are The Most Likely Catalysts For A Broader Market Pullback

Such headlines are what we tend to see at short-term market tops.
While the phase one trade deal is a good thing, and China’s President Xi has confirmed he’s looking forward to signing the agreement in January, that doesn’t mean the trade conflict is over.
Moody’s estimates just a 15% probability that the trade conflict will end by-election day 2020, which seems like a reasonable estimate given how many complex issues have yet to be addressed.
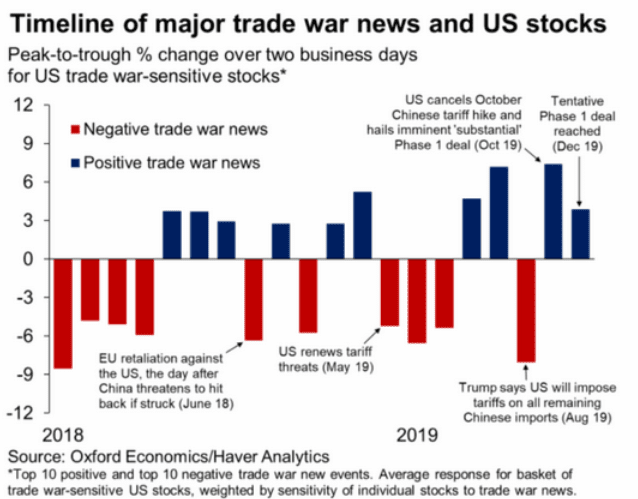
Trade sensitive stocks, such as industrials and technology, have been doing very well of late, on trade deal optimism.
We saw the same thing in April 2019, when Wall Street’s consensus was that a full trade deal that ended all tariffs was days away. Then this happened.
May 2019 Trade Induced Pullback
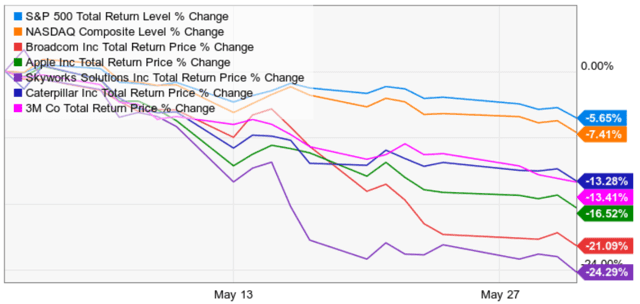
(Source: Ycharts)
Of course, it was foolish to sell quality companies merely due to trade conflict fears, and this proved to be a historically normal pullback. It lasted exactly one month, saw stocks fall 6%, and within a month the market was back to record highs.
In fact, here’s how these trade-sensitive stocks have done since the bottom in May.
What “Greedy When Others Are Fearful” Gets You
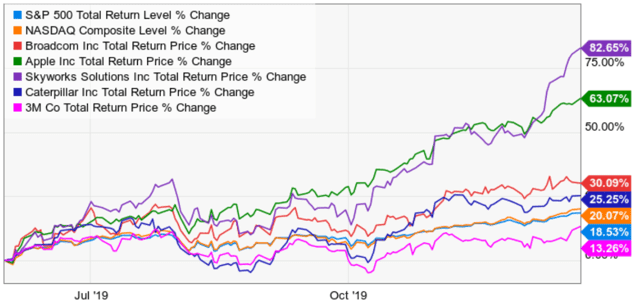
(Source: Ycharts)
The other major pullback/correction catalyst for 2020 is inflation worries. Better than expected economic data is what triggered the early 2018 correction, in which stocks began 15% historically overvalued and then fell 10% within a week.
Market history never repeats but it does serve as an important teacher of valuable lessons long-term investors need to embrace if they are to achieve their long-term goals.
(Source: imgflip)
Scary volatility in December 2018 is the reason stocks are up 31% in 2019 (and counting).
Scary volatility in May is why trade-sensitive stocks have crushed the market, in some cases soaring 30% to 82% in a matter of months.

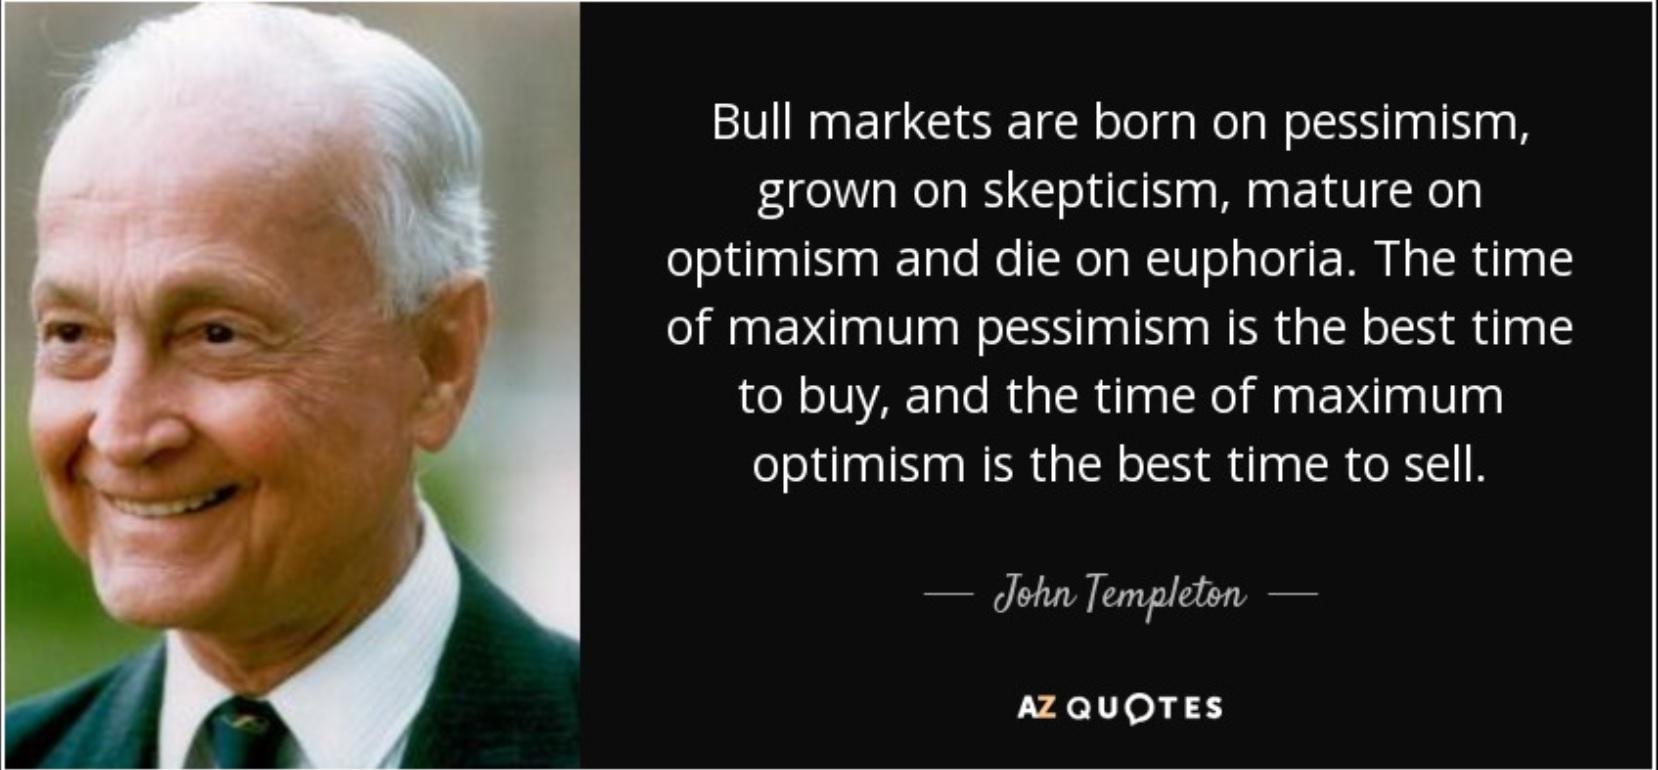
(Source: AZ Quotes)
If you understand that volatility is normal, healthy and the reason that stocks are the best performing asset class in history, then you don’t have to worry about being lucky in the market. Smart investors, buying quality assets at reasonable to attractive valuations, make their own luck.
SPY shares were trading at $321.27 per share on Monday afternoon, up $0.54 (+0.17%). Year-to-date, SPY has gained 30.34%, versus a 30.34% rise in the benchmark S&P 500 index during the same period.
About the Author: Adam Galas

Adam has spent years as a writer for The Motley Fool, Simply Safe Dividends, Seeking Alpha, and Dividend Sensei. His goal is to help people learn how to harness the power of dividend growth investing. Learn more about Adam’s background, along with links to his most recent articles. More...
More Resources for the Stocks in this Article
| Ticker | POWR Rating | Industry Rank | Rank in Industry |
| SPY | Get Rating | Get Rating | Get Rating |


