
Few monthly economic reports move the market more than the monthly jobs report. For example, the S&P 500 rose 1% on the blowout November report which was good enough to generate a 0.2% weekly gain or the 8th positive week out of the last nine.
But as with most macroeconomic reports, there is a lot of nuances that investors might not get from initial media coverage. So let’s take a look at the three most important facts about the November report, to see what it likely means for the broader market in 2020 and possibly beyond.
Fact 1: The Numbers That Matter
Here are the biggest headline figures the media focused on in the latest jobs report.
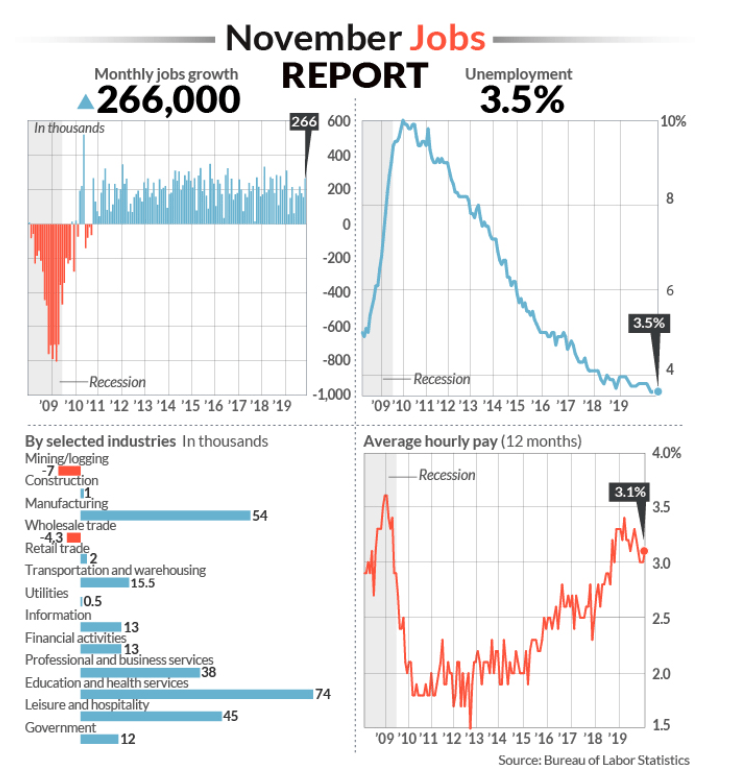
(Source: MarketWatch)
The 266,000 net jobs created in November were 86,000 above the 180,000 most economists were expecting. Even factoring in the 42,000 GM strike jobs that were added back in, the results were exceptionally strong.
The headline, u3 unemployment rate of 3.5% was 0.1% better than expected and the lowest level since December 1969. The more informative U6 underemployment rate of 6.9% (6.5% none-seasonally adjusted) was slightly improved to last November’s 7.2%.
What matters most to the economy is wage growth which came in at 3.1% YOY. However, non-supervisory wages, which account for 80% of the labor force, was a much stronger 3.5% YOY, a trend we’ve seen all year.
What are the most important takeaways from the report? That strong small business confidence and a service sector that accounts for 85% of US job creation are more than able to offset weakness in manufacturing, mining (mostly energy) and trade-related industries, all of which are suffering from the trade war.
However, this brings us to fact two, which is also incredibly important for investors to understand.
Fact 2: These Are Preliminary Estimates
The US economy is enormous with over 150 million employed workers, millions of businesses, and thus the monthly jobs report is actually a survey-based estimate with a margin of error of 120,000.
Specifically, the Bureau of Labor Statistics estimates that there is a 90% probability that the actual number of new jobs created last month was within 120,000 of the headline 266,000 estimate (so 146,000 to 386,000).
Each report is revised twice, in the following months. For November the September and October reports were revised up 41,000 which is great news for the economy.
That raised the three-month average to 205,000, above the 2019 average of 180,000.

(Source: Fivethirtyeight.com)
But revisions can also show far-less jobs created than initial estimates, which is why the three-month average is a more significant metric than job creation in any given month.
It’s also important to note that the BLS does an annual revision in February using actual unemployment data from each individual state. Since unemployment claims are most accurate at the state level, this gives us a still imperfect but more accurate number of jobs created or lost in any given year.
In 2018 the BLS’s current employment statistics survey, using state-level unemployment claims data, found 501,000 fewer jobs created than initially thought. Or to put another way, the monthly job reports estimated that almost 3.2 million net jobs were created in 2018, but that was later revised down to 2.7 million or 16% less.
What does this mean for investors? While it’s OK to be excited by good news, it’s also important not to forget the statistical nature of these reports. Headline results should never be taken as a reason to either buy or sell stocks or make any other major investment decisions, since these results are preliminary and will change in the future, sometimes dramatically.
What matters far more is the trend over time, and how that affects both the US economy and corporate earnings.
Fact 3: The Trend Over Time Will Determine How Healthy The Economy Will Be In 2020 and Beyond
The reason the job report is so important is that consumers pay a lot of attention to it and 65% to 70% of the US economy is driven by consumer spending.

Wage growth has been anemic, averaging 4% since 1950 according to JPMorgan Asset Management, but never coming close to that amount since 2009. However, wage growth has been in an upward trajectory and more importantly, beginning in 2019, non-supervisory wages began to outpace average hourly wage growth.
When adjusted for inflation (currently 1.6%), real wage growth is now 1.9% for 80% of workers, the strongest its been in a decade.

And even that doesn’t truly highlight the improvement in the US economy for most workers. About 10,000 baby boomers are retiring each day through 2034, and retiring workers are reducing the average for everyone because people make the most towards the end of their careers.

Median wage growth as tracked by the Atlanta Fed has been trending higher for a decade, as the labor market heals from the worst recession since WWII (that one was created by the demobilization of a wartime economy).

What’s more, among job switchers, people who left their current position for a better job, median wage growth is 4.1% and that’s also been steadily rising over time.

The quit rate, what percentage of workers quit each month, is one of the best proxies for how confident workers are about the state of the labor market. As you can see, the quit rate tends to fall during recessions, and rise during expansions.
The Great Recession was so traumatic that the quit rate collapsed to 1.2% and it took until mid-2019 before it returned to pre-recessionary levels.
The record high quit rate was 2.5% during the 90s boom and we recently hit 2.4% before falling back down during September, the most recent month of data available.
Charles Schwab estimates that 107,000 net monthly jobs are required to keep up with population growth. Any figure above this will tighten the labor market even more, raise wages, and bring more people into the labor force.
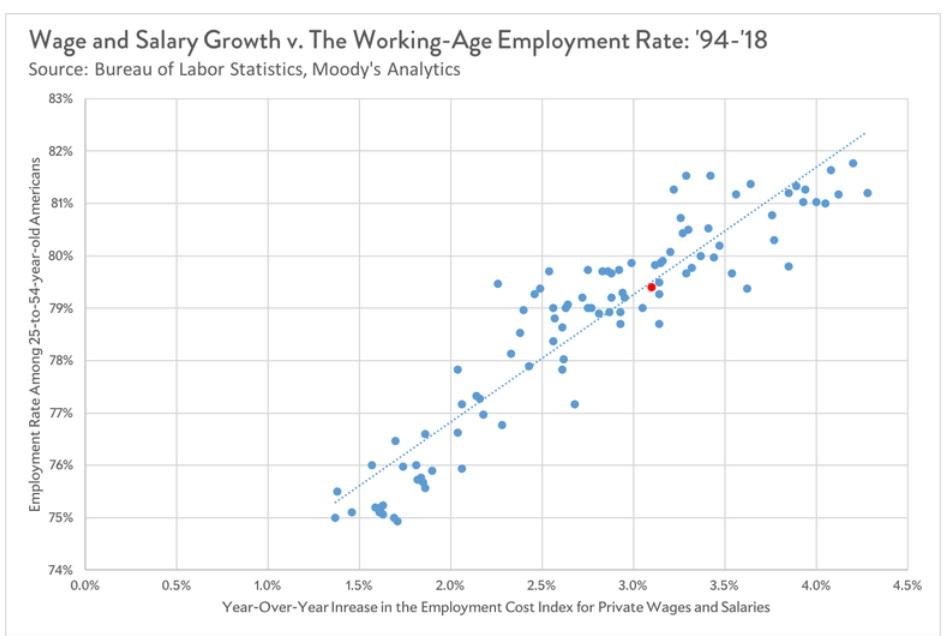
One of the biggest reasons that wage growth has been so weak this recovery has been the big decline in prime-age participation. There is a strong correlation between the number of 25 to 54-year-old working Americans and wage growth.

Right now there are about 27 million prime-age workers not in the labor market, but that figure is steadily declining as unemployment falls, wages rise and less-skilled workers have an easier time finding employment.
What is the takeaway from all these charts? That the steady economic expansion has finally started helping the people who need it most. And as long as we avoid recession in 2020 (all but a certainty now) and 2021 then chances are good that the strong job market will continue to chug along helping the Main street the most.
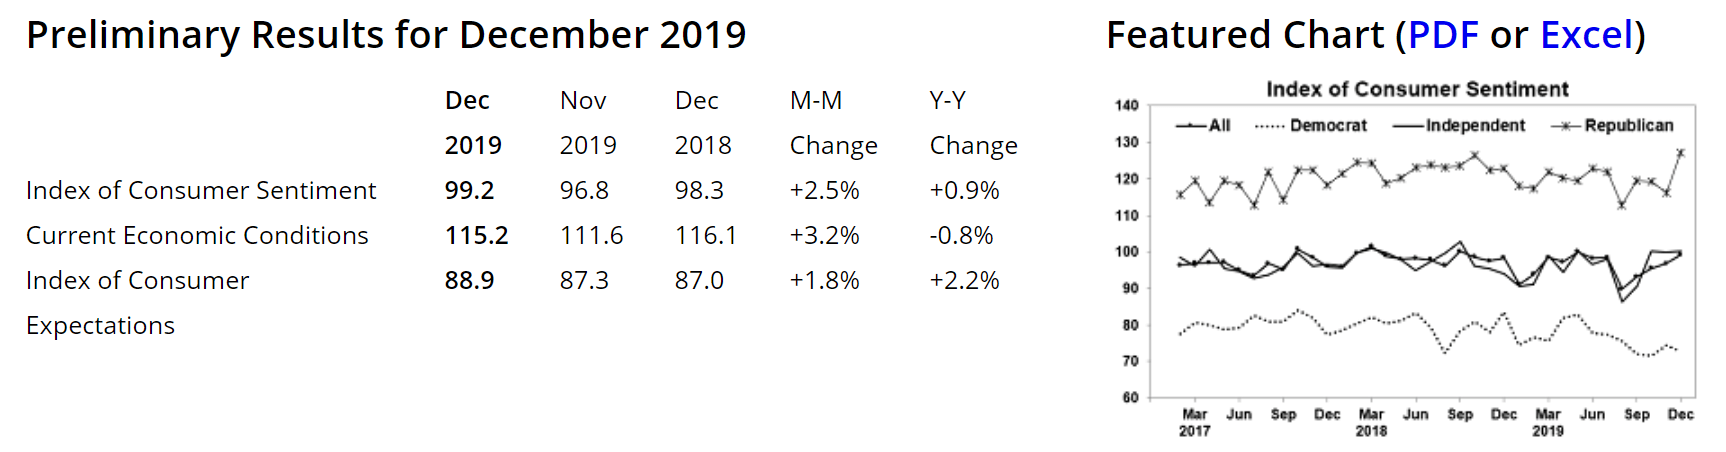
(Source: University of Michigan)
In fact, the preliminary consumer sentiment survey from the University of Michigan (one of the eight most important leading indicators that predict recessions) jumped strongly in December. That includes the index for future expectations which was up 1.8% from November and 2.2% higher than November 2018.
That’s very bullish for the economy because October 2018 was the peak of this economic cycle, as measured by 19 leading economic indicators as tracked by David Rice’s Baseline and Rate of Change or BaR economic grid.

(Source: David Rice)
Today the economy is actually stronger than it was back in 2016 when the oil crash caused a mild manufacturing recession and many feared a recession was imminent.
What does the economy look like today?
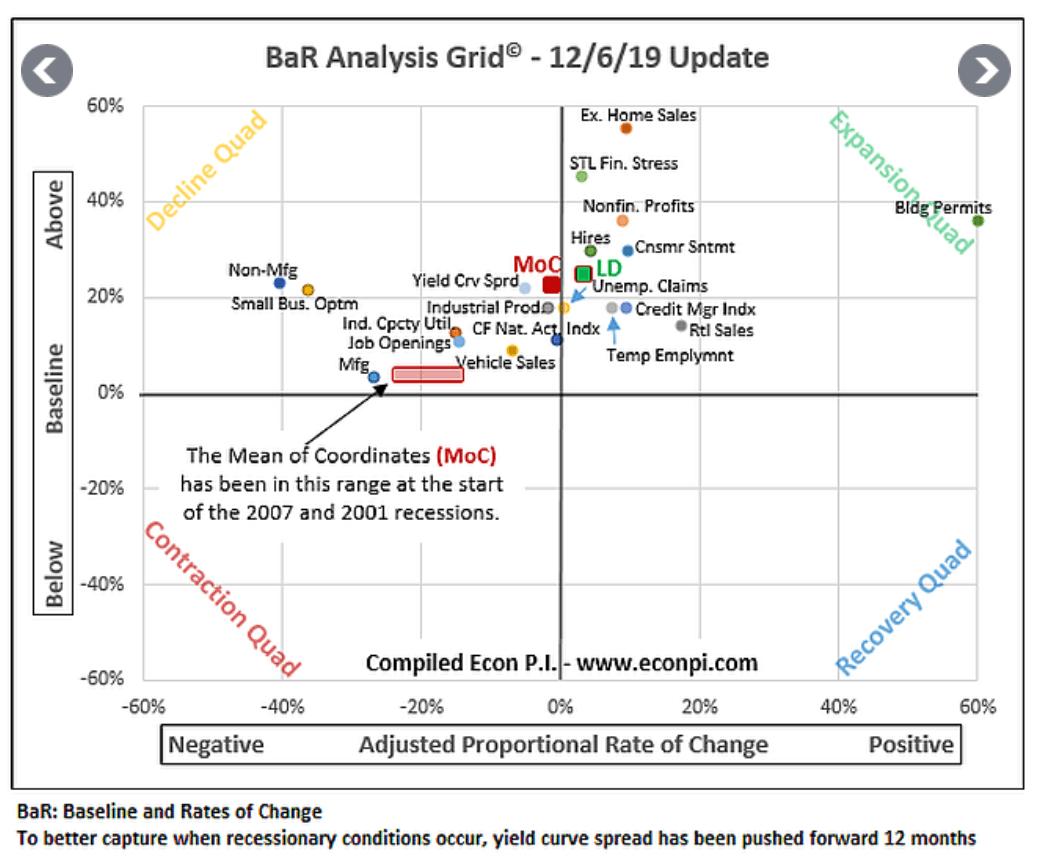 (Source: David Rice)
The average of all 19 leading indicators is 22.9% above the recessionary baseline and the eight most important indicators (the green LD dot) are 25.5% above baseline and getting better month to month at an accelerating rate.
What does all this data actually mean? Simply that
- the current tariffs are only enough to hurt economic growth, not likely turn it negative
- the labor market is resilient and likely to keep getting better
- wage growth is likely to keep improving over time as long as we avoid recession (now a 74% probability event)
- consumer confidence is likely to remain strong (per University of Michigan’s chief economist)
Might things still take a turn for the worse? Absolutely. Here’s what Moody’s Chief Economist Mark Zandi told MarketWatch in November.
Recession risks for next year remain uncomfortably high…The economy is barely growing at its potential, which means unless growth picks up soon, unemployment will begin to rise… If the president follows through on his threat to raise tariffs again on China in December, a recession next year is likely…However, if the president stands down and provides a clear path to winding down the tariffs, the economy will likely avoid a recession.” – Mark Zandi (emphasis added)
Moody’s estimates that a phase one trade deal sometime in 2020 is likely, though there is just a 15% probability of a full end to the trade war next year.
If we get a reduction in some tariffs (the September ones are most likely to be rolled back) then confidence among businesses and consumers will likely rise some more.
If the December 15th tariffs go up as currently scheduled it could trigger a sudden decrease in optimism, as well as a broader market pullback.

The last time the trade war escalated the Bank of America consumer confidence index crashed and that could happen again.
But guess what? Just because something bad might happen is no reason investors should sell stocks and wait for uncertainty to lift.
(Source: Michael Batnick)
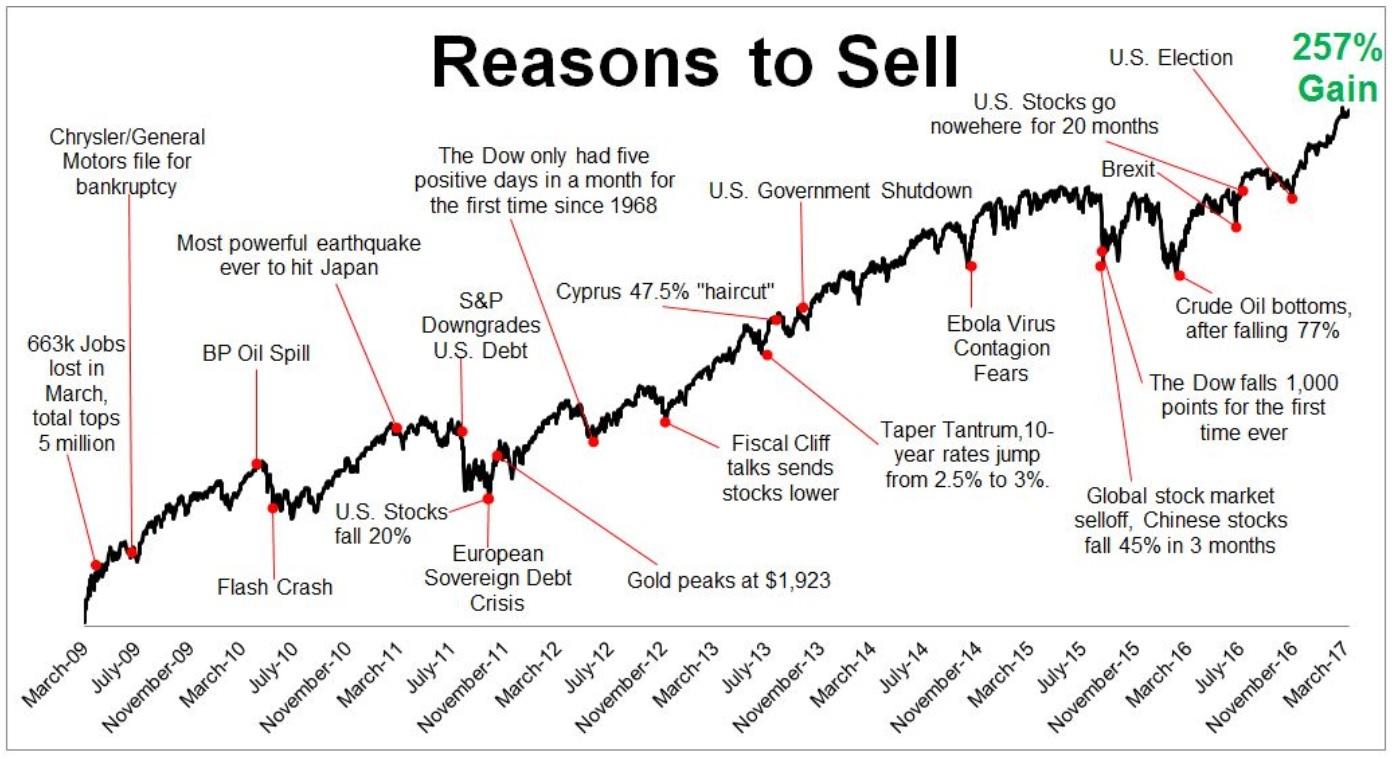
Recently the S&P 500’s record high made this not just the longest bull market in history but the strongest in terms of total returns (on an absolute basis).
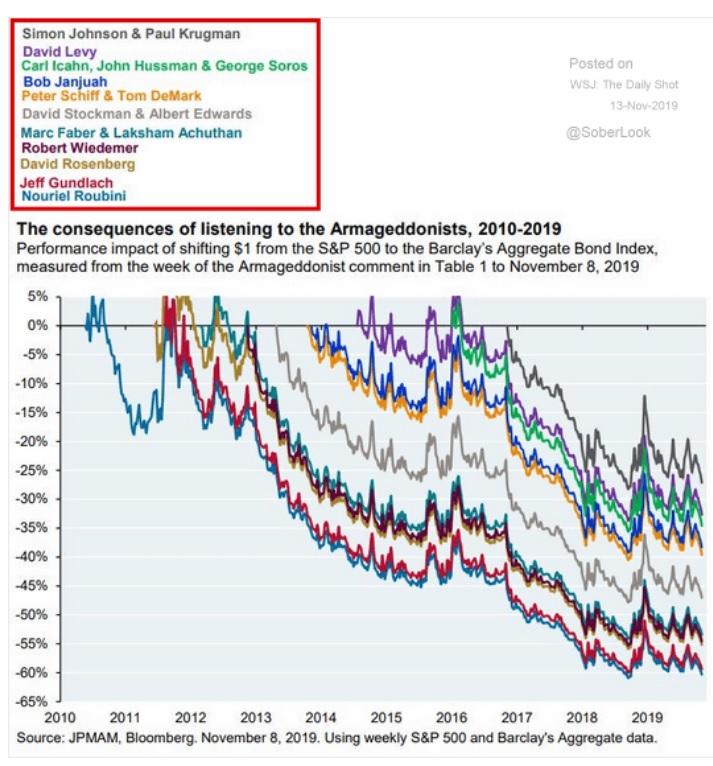
Along the way to nearly 500% total returns investors who listened to the doomsday pundits that the media loves to put on TV, have suffered immense losses. And that’s simply if they went long bonds and pulled money out of stocks. Those who sorted the market did even worse than potentially 60% losses while the market rose for a decade.
According to the Wall Street Journal using Lipper Financial Data, during 2019’s 25% market rally retail investors pulled $137 billion out of stock ETFs and mutual funds. Or to put another way, most retail investors have not benefitted from the strongest year for stocks since 2013.

That probably explains why wealth inequality so many now decry has gotten worse over time. The “rich” are the ones that generally buy and hold for the long-term. Small-time investors try to time the market and achieve terrible results over time.
A 2002 study by the University of California, Davis found that the more you trade the worse you do, after fees and costs.

And don’t think that experience can help you trade better, because no less than John Bogle, founder of Vanguard, says that’s not the case.
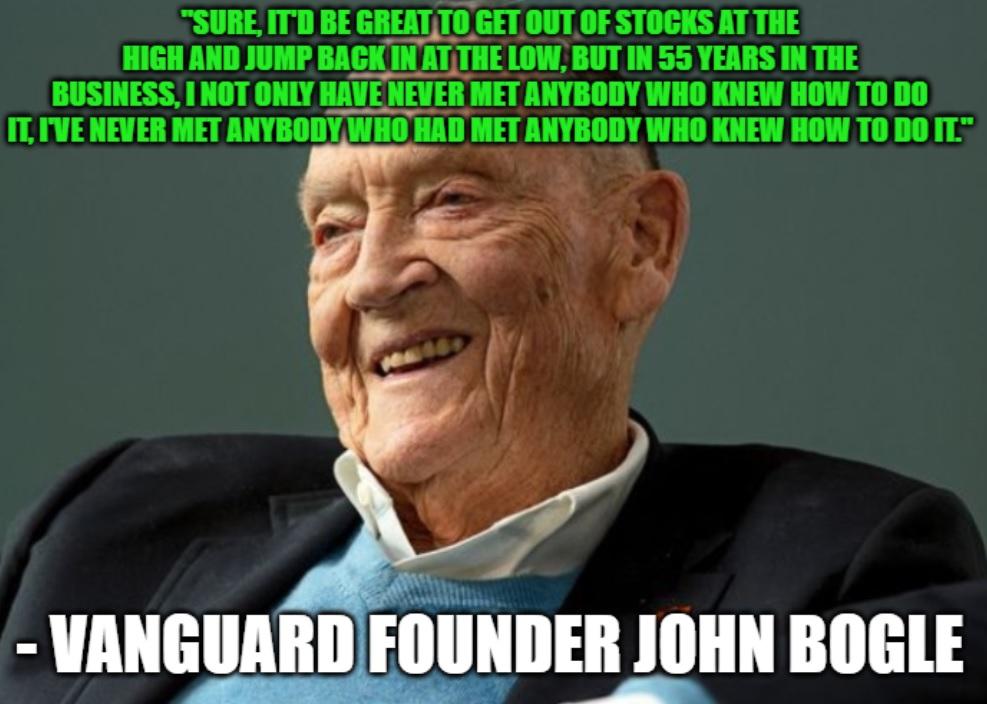
(Source: imgflip)
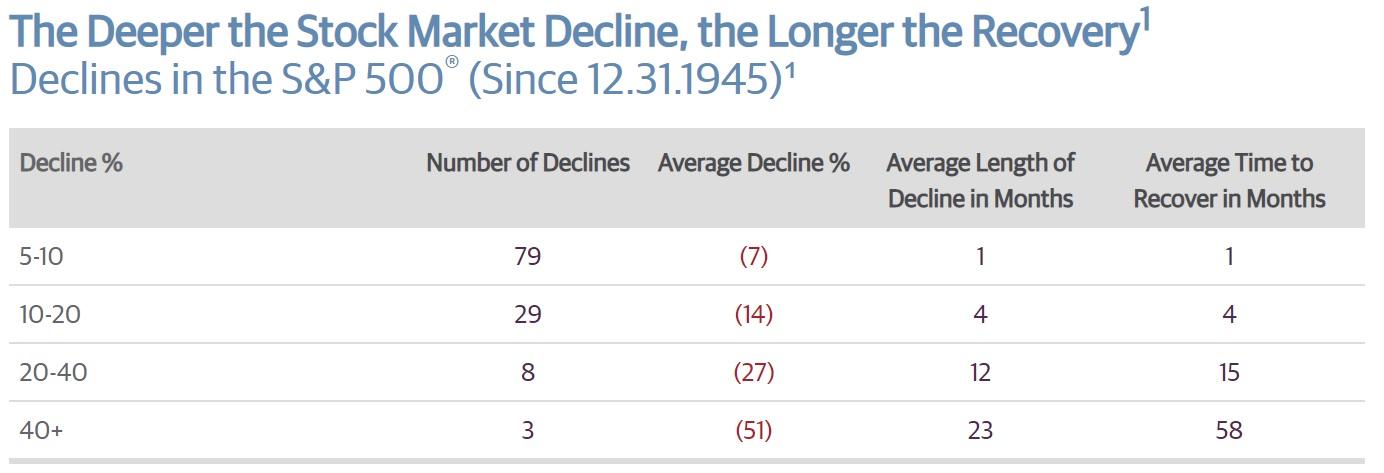
(Source: Guggenheim, Ned Davis Research)
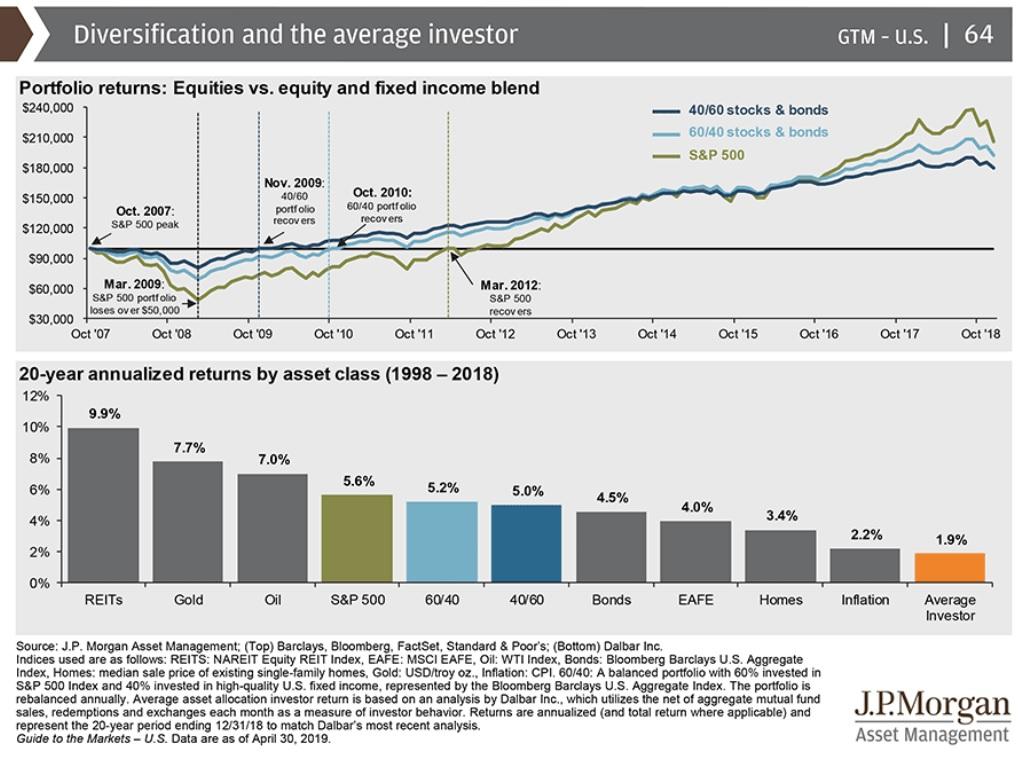
Pullbacks and corrections are normal and healthy and in fact, the very reason that stocks are the best performing asset class in history.
5% to 10% pullbacks occur on average (since 1945) every year, corrections of 10% to 20% every 2.5 years, and bear markets once every decade. But bear markets typically require a recession (which we are not at high danger of right now), and severe bear markets of 40+% declines require a special catalyst.
That includes either extreme valuations (the broader market is 13% historically overvalued right now according to JPMorgan Asset Management) or a severe economic shock.
This is why on average they occur every 25 years. The doomsday prophecies we see so frequently are purely because pundits want to get on TV to sell something, such as books or peddle their hedge fund asset management business.
You don’t get on TV or invited to industry conferences, or big book deals, for predicting average outcomes. Pundits get paid for sitting three standard deviations away from sane analysts. Take away that incentive and you’d find that many extremists – even respected ones – are merely opportunists.” – Morgan Housel, “The Psychology of Prediction” (emphasis added)
The bottom line is that smart investors should trust in prudent risk management and portfolio construction and not try to time the market, especially based on doomsday predictions of imminent market crashes.
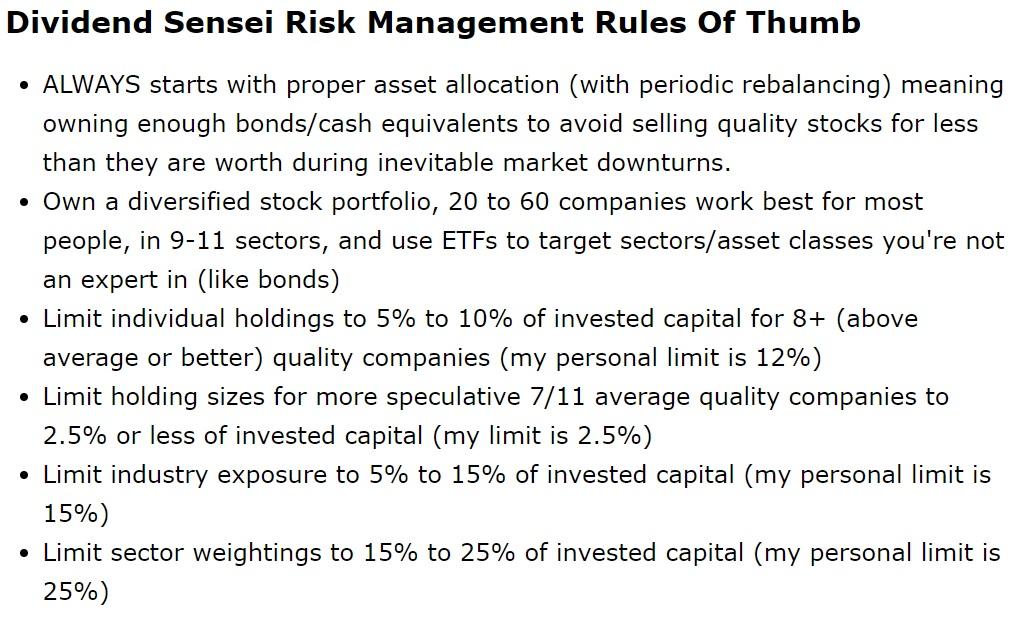
I have 100% of my life savings invested in stocks and sleep very well at night following the above risk management guidelines. Will the market experience a lot of volatility in the future? You bet.

(Source: imgflip)
Will I ever sell quality companies I bought at a reasonable price purely due to concerns about short-term pullbacks or corrections? Absolutely not.

The purpose of all my articles is not to tell you what the market will do next week, next month or next year. It’s to help you build a strong foundation of sound investing principles so that you can create your own luck and maximize the probability of achieving your long-term financial goals.
SPY shares were trading at $314.17 per share on Wednesday morning, up $0.64 (+0.20%). Year-to-date, SPY has gained 27.46%, versus a 27.46% rise in the benchmark S&P 500 index during the same period.
About the Author: Adam Galas

Adam has spent years as a writer for The Motley Fool, Simply Safe Dividends, Seeking Alpha, and Dividend Sensei. His goal is to help people learn how to harness the power of dividend growth investing. Learn more about Adam’s background, along with links to his most recent articles. More...
More Resources for the Stocks in this Article
| Ticker | POWR Rating | Industry Rank | Rank in Industry |
| SPY | Get Rating | Get Rating | Get Rating |