In part one of this series, we saw why Q2’s earnings growth is potentially going to be the best we’ve seen in 12 years, and might ever see again, at least within our lifetimes.
We also saw why analysts are so bullish about earnings growth in the medium and long-term, with earnings growth that’s potentially 50% above its historical rate.
Now I want to highlight the two most important facts that determine how your portfolio likely does for the rest of 2021 and far beyond.
Fact 3: Earnings Growth MIGHT Be Enough To Prevent A Bear Market But Don’t Count On It
| Year | EPS Consensus | YOY Growth | Forward PE | Blended PE | Overvaluation (Forward PE) | Overvaluation (Blended PE) |
| 2020 | $138.01 | -13.93% | 26.6 | 26.0 | 59% | 50% |
| 2021 | $192.93 | 39.79% | 22.2 | 24.4 | 33% | 41% |
| 2022 | $214.90 | 11.39% | 19.9 | 21.1 | 19% | 22% |
| 2023 | $230.12 | 7.08% | 18.6 | 19.3 | 11% | 11% |
| 12-Month forward EPS | 12-Month Forward PE | Historical Overvaluation | PEG | 20-Year Average PEG | S&P 500 Dividend Yield | 25-Year Average Dividend Yield |
| $192.56 | 22.231 | 33.04% | 2.62 | 2.35 | 1.45% | 2.04% |
(Source: Dividend Kings S&P 500 Valuation Tool)
Based on blended earnings, both trailing and forward-looking, it’s a historically expensive market.
In fact, other than the spread between corporate bond yields and earnings yields, the market is extremely overvalued by basically every metric.
This is why the media is so happy to bring us perma-bear forecasts about epic crashes, such as GMO, which is forecasting -7% CAGR total returns for stocks over the next 7 years.
In other words, stocks in seven years will be 40% lower than they are today, including dividends.
And such dismal forecasts look tame compared to such famous perma-bears as John Hussman.

Mr. Hussman, who became famous after the Tech and Financial Crises, has predicted as much as a 70% crash in the market.
Fortunately for most investors, such dire predictions are not anywhere close to the blue-chip consensus.

JPMorgan’s blue-chip economists are forecasting about zero returns over the next five years.
Compared to a 40% crash that seems like heaven. Compared to the 14% CAGR we’ve seen over the last 10 years, it would probably feel like hell for most investors.
A recent survey of investors around the world found that they expected about 17% annual returns over the next decade, higher than the last decade, which was one of the best bull markets in US history.
FactSet Consensus Total Return Potential
| Year | Upside Potential By End of That Year | Consensus CAGR Return Potential By End of That Year | Probability-Weighted Return (Annualized) |
| 2021 | -21.39% | -37.03% | -27.77% |
| 2022 | -10.79% | -7.24% | -5.43% |
| 2023 | -2.76% | -1.11% | -0.83% |
| 2024 | 7.18% | 1.99% | 1.49% |
| 2025 | 17.96% | 3.72% | 2.79% |
| 2026 | 29.66% | 4.82% | 3.49% |
(Source: Dividend Kings S&P 500 Valuation Tool)
Analysts, in general, expect close to 5% annualized total returns, and 6% from the dividend aristocrats.
In other words, not as bearish as the doomsday prophets warn about, but less than 1/3rd of what most retail investors expect.
What if earnings continue to beat expectations this year? Might that not improve the short to medium-term market return outlook?
That’s certainly possible. At the start of the year stocks traded at 23X forward earnings. After a nearly 15% rally, earnings growth has been so strong that stocks trade at about 21X forward earnings.
If earnings were to beat expectations for the rest of the year by the same 23% we saw in Q1 (the best case scenario), then we’d see 63% earnings growth in 2021.
2022 estimates have been moving in tandem with 2021 estimates thus far, and if that were to hold then 2022 earnings would be about $250.
Or to put another way, if stocks traded flat for the rest of the year the forward PE would be 17.1, at the high end of historical fair value
Historically, stocks very seldom grow into very high valuations, but rather see a return to fair value via a sharp correction.
But there was nothing normal about 2020 or this pandemic, and so it’s always possible that this epic rally might prove far more sustainable than pessimists believe.
Fact 4: There Are Still Lots Of Blue-Chips Set To Fly Even With The Market At Record Highs
Sound investing is not about hope, but disciplined financial science.
Dividend Kings Phoenix: Blue-Chip Stock Picking Made Easy
| Metric | US Stocks | Real Money Phoenix Recommendations |
| Great Recession Dividend Growth | -25% | 0% |
| Pandemic Dividend Growth | -1% | 6% |
| Positive Total Returns Over The Last 10 Years | 42% | 100% |
| Lost Money/Went Bankrupt Over The Last 10 Years | 47% | 0% |
| Outperformed Market | 36% | 47% |
| Bankruptcies Over The Last 10 Years | 11% | 0% |
| Permanent 70+% Catastrophic Decline Since 1980 | 40% | 0% |
| 100+% Total Return Over The Past 10 Years | NA | 88% |
(Sources: Morningstar, JPMorgan Asset Management, FactSet, Seeking Alpha)
Stock picking is hard unless you use a comprehensive approach like what Dividend Kings does with our Phoenix strategy.
- Only buying the highest quality blue-chips, the ones most likely to rise like a Phoenix from the ashes of this recession, and soar to new heights
Today there are dozens of wonderful companies for any given goal or risk profile. Yield? Value? Maximum growth and returns? Low volatility? Strong ESG? Maximum fundamental safety? It doesn’t matter, something wonderful is always reasonable to attractively valued if you know where to look.
ENB 2023 Consensus Total Return Potential
(Source: FAST Graphs, FactSet Research)
ENB 2026 Consensus Total Return Potential
(Source: FAST Graphs, FactSet Research)
PM 2023 Consensus Total Return Potential

(Source: FAST Graphs, FactSet Research)
PM 2026 Consensus Total Return Potential
(Source: FAST Graphs, FactSet Research)
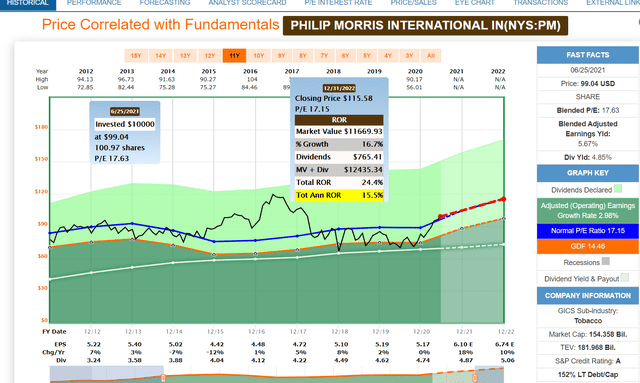
Enbridge and Philip Morris are just two examples of high-yield dividend aristocrats that analysts expect to deliver 100+% total returns over the next five years.
During a period when JPMorgan thinks stocks go nowhere, and most analysts expect 30% returns, here are two wonderful companies at fair value or better, that are likely to smash the market and aristocrats in the next half-decade.
(Source: FactSet Research Terminal)
(Source: FactSet Research Terminal)
And with double-digit growth consensus forecasts, these 4.8% to 6.8% yielding blue-chips are likely to deliver aristocrat-beating returns for decades to come.
And that’s just two examples out of dozens available right now, when the market is 33% historically overvalued.
This is just another example of how it’s always a market of stocks and not a stock market. And no matter what your goal, time horizon, or risk profile, something great is always on sale in all market environments.
SPY shares were trading at $432.50 per share on Friday afternoon, up $2.07 (+0.48%). Year-to-date, SPY has gained 16.44%, versus a % rise in the benchmark S&P 500 index during the same period.
About the Author: Adam Galas

Adam has spent years as a writer for The Motley Fool, Simply Safe Dividends, Seeking Alpha, and Dividend Sensei. His goal is to help people learn how to harness the power of dividend growth investing. Learn more about Adam’s background, along with links to his most recent articles. More...
More Resources for the Stocks in this Article
| Ticker | POWR Rating | Industry Rank | Rank in Industry |
| SPY | Get Rating | Get Rating | Get Rating |


