In part one of this series, we learned why the debt ceiling has no big deal, but this time might be different. In fact, analysts and economists believe the debt ceiling is currently the single biggest risk to the stock market.
Now let’s look at the two most important facts about the debt ceiling, and why it could potentially trigger a December 2018 style market crash, and how you can not only avoid losing money but possibly make a fortune from a short-term market freakout.
Fact 3: Why This Could Trigger Another Great Recession
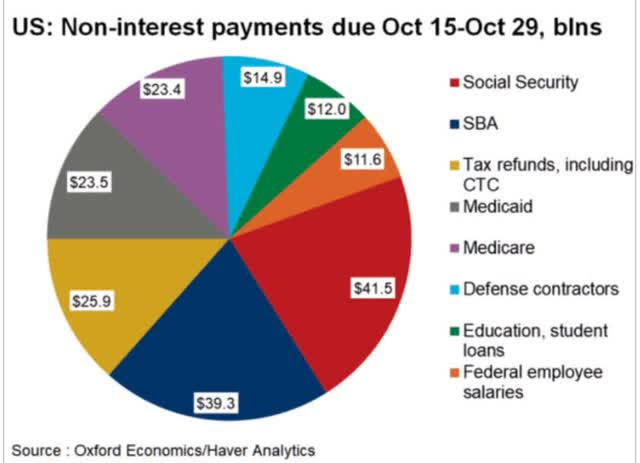
The US government has never defaulted on its debt and that’s why US treasuries are the most popular “risk-free” asset on earth. Since the late 1940s, much of the global economy has been built around the risk-free nature of US bonds, and now we have $80 billion in liabilities coming due in the second half of October alone.
Every day the US government has money flowing in through things like payroll taxes and estimated tax payments from small businesses and corporations.
And every day the government is paying bills, to people like contractors, employees, and social security recipients.
The Treasury Department is in charge of making sure the government always pays its bills on time but Secretary of the Treasury Janet Yellen has warned that by mid-October the government might have to start defaulting on its liabilities.
That will create some very big problems because as we proceed further beyond the drop-dead date, more and more people won’t get the money that’s owed them.
For example, veteran pensions could be disrupted, social security payments could be missed, and Federal employees might not get paid, the same with contractors.
During government shutdowns, social security and veteran pensions are funded from separate sources and have never been disrupted. This time they might be.
The drop-dead date is the absolute limit of the debt ceiling beyond which the US starts defaulting.
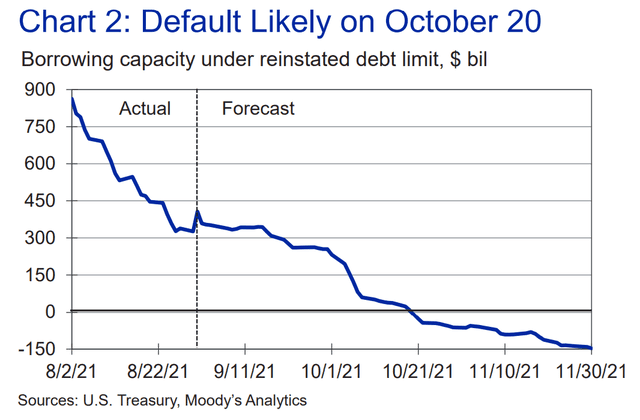
Moody’s estimates October 20th is the drop-dead date by which the debt ceiling must be raised to avoid a default.
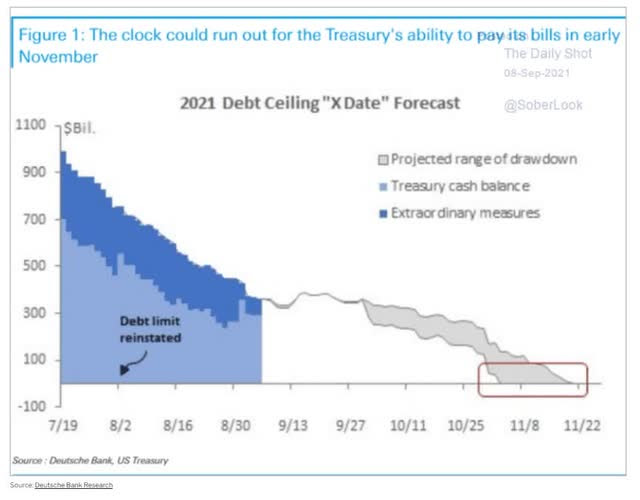
Deutsche Bank estimates it might be in late October and possibly as late as November 20th or so.
Secretary Yellen, who is in charge of making sure America pays its obligations on time, says that mid-October is the drop-dead date, possibly just three weeks away.
What happens if we breach the drop-dead date? Very bad things indeed.
Moody’s Base Case Economic Model For A US Debt Default
Moody’s chief economist Mark Zandi doesn’t mince words about what happens if the US government defaults.
This economic scenario is cataclysmic.
Based on simulations of Moody’s Analytics model of the U.S. economy, the downturn would be comparable to that suffered during the financial crisis.
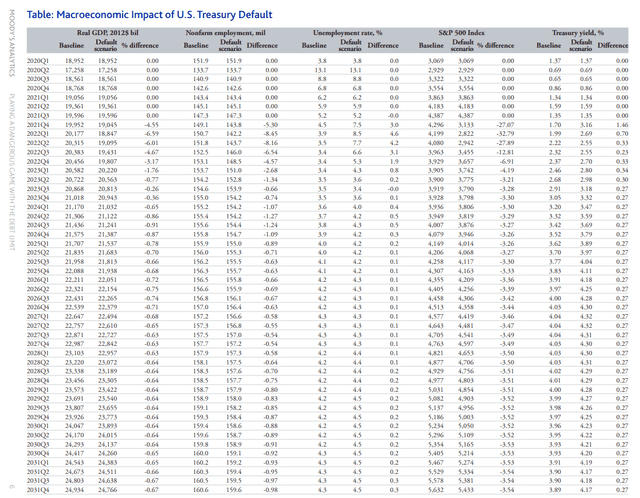
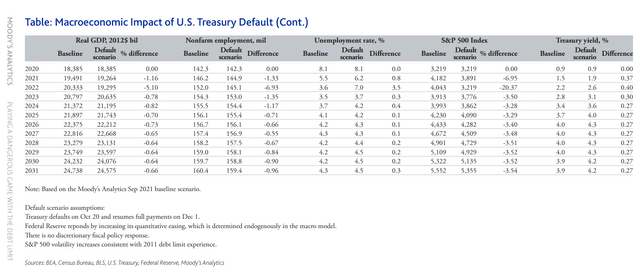
That means real GDP would decline almost 4% peak to trough, nearly 6 million jobs would be lost, and the unemployment rate would surge back to close to 9% (see Table).
Stock prices would be cut almost in one-third at the worst of the selloff, wiping out $15 trillion in household wealth. Treasury yields, mortgage rates, and other consumer and corporate borrowing rates spike, at least until the debt limit is resolved and Treasury payments resume.
Even then, rates never fall back to where they were previously. Since U.S. Treasury securities no longer would be risk-free, future generations of Americans would pay a steep economic price.” – Moody’s
Moody’s assessment is echoed by not just Janet Yellen, and the credit rating agencies, but no less than six former Treasury secretaries from both parties.
The speed of this potential recession could be jaw-dropping, surpassed only by the two-month depression created by the COVID-19 pandemic lockdowns that saw GDP contract at a 32% annual rate from March to April 2020 and 20 million Americans lose their job in a single month.
For context, that was equal to the number of net jobs created in the entire previous decade.
In this potential crisis, Moody’s estimated 8.5 million Americans could lose their jobs by the end of Q1 2022. For context, the Great Recession, the 2nd worst recession in 75 years, saw 8 million net job losses over two years.
This time we could lose 8.5 million jobs in 6 months as unemployment nearly doubles, the economy contracts 6.5% and the stock market plunges 33%.
In March 2020, the pandemic crash stocks fell 34% in a month, the fastest bear market in history.
This time Moody’s thinks it might be a six-month decline that wipes out $15 trillion in shareholder wealth, more than the pandemic crash.
Even 10 years later, Moody’s estimates the US government will be paying 0.3% higher interest rates, and the economy will be 0.7% smaller, with an extra 1 million Americans unemployed.
In other words, we face a financial crisis unprecedented in its stupidness and preventability. Fortunately, this is merely the worst-case scenario and not what’s most likely to happen.
Fact 4: What’s Actually Likely To Happen
It is unimaginable that lawmakers would allow things to get to this point, but as the TARP experience highlights, they have done the unimaginable before. Yet, if that experience is a guide, lawmakers would quickly reverse course and resolve the debt limit impasse to allow the Treasury to raise funds and pay its bills. Much damage will have already been done, but markets and the economy would right themselves.” – Moody’s
Moody’s points out that Congress has done a lot of stupid things in the past, including the TARP bailout failing on the 1st attempt.
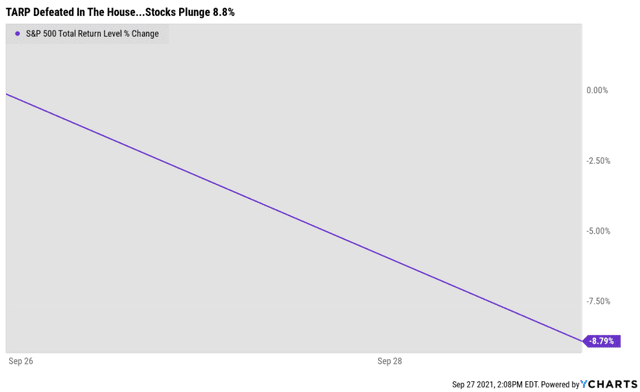
Stocks reacted rather poorly to that vote, with the S&P plunging almost 9% on September 29th, 2008.
But the very fact that stocks can crash when Congress acts stupidly is precisely why economists and analysts think an outright debt default is unlikely.
That’s because Secretary Yellen has the ability to decide what bills get paid and which don’t. For example, US bond interest and principal repayments are likely to take first priority at the expense of Federal government pay.
Social security, Medicare/Medicaid payments and veterans benefits could all be temporarily deferred to ensure that US bond investors get paid on time, and thus avoiding a technical default that could torpedo the entire global financial system.
And here’s the upside of a plunging stock market. Just as the fact that the market crashed 9% when TARP failed, that forced Congress to act quickly passing TARP.
Now don’t get me wrong, TARP was far from a perfect bill, but it did prevent a global economic collapse, and the US government ultimately got repaid 100% of that money and made a profit on it.
Here’s the most likely scenario that’s probably going to unfold should Congress drag its heels on the debt ceiling.
The market wobbles increasingly in the first week of October, as the doomsday clock ticks steadily away.
By the 2nd week of October, stocks could be sliding rather steadily, as the market begins to worry about the first default in US history.
Since no one knows the exact drop-dead date, which could range from October 10th through the end of November, every day that passes would likely make the market more nervous.
This could be the catalyst for an accelerating correction like we saw in the final three weeks of December 2018.
But here’s the good news and why the doomsday scenario, including 8.5 million Americans losing their jobs in 6 months and stocks cratering by $15 trillion is unlikely.
It’s the golden rule, “he who has the gold makes the rules”.
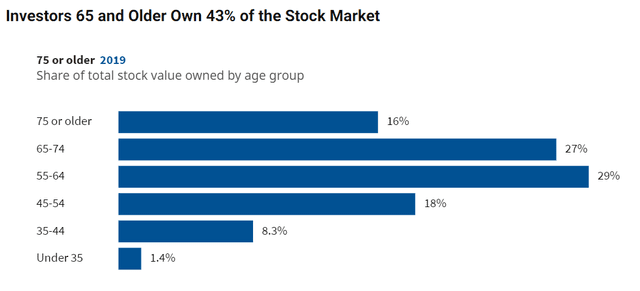
Families in the top 10% of incomes held 70% of the value of all stocks in 2019, with a median portfolio of $432,000. The bottom 60% of earners held only 7% of stocks by value. The median middle-class household-owned $15,000 worth of stock.”- US News and World Report
(Source: US News and World Report)
Studies show that about 80% of the time politicians do what the top 20% want.
The most dependable voting block is retirees. Who now over well over 43% of the stock market.
The top 20% own approximately 90% of the stock market.
A worst-case debt default would wipe out $15 trillion in stock market value according to Moody’s.
- $13.5 trillion wealth destruction for the top 20%
- retirees would be screwed, losing about $7.5 trillion on paper, or more than $1 trillion per month
This second great recession would be the stupidest and most preventable financial catastrophe in history.
Politicians are often stupid, but not likely to allow this catastrophe to take place.
A 15% to 20% correction would very likely cause Senate Majority Leader McConnel to change his mind about the GOP filibustering a debt-ceiling increase because his donors would rake him over the coals due to trillions in mounting losses.
In other words, the people pulling the strings don’t want this to happen and thus it likely won’t.
Does that mean that no one should worry about the debt ceiling crisis? Nope.
Those with poor risk management for their needs have every reason to worry.
For example, consider the lesson of Bill Hwang of Archegos Capital fame.
Mr. Hwang started with $200 million of his own money in 2013 and by 2020 had $20 billion. How the heck did he manage to increase his wealth by 100X in just seven years, a compound rate of 93% annually?
Simple, he used options to leverage 7X on US large-cap tech, during one of the hottest tech bull markets in history.
And as his wealth grew, he kept leveraging the paper profits to keep his leverage at very high without using hedges.
At some point, it was inevitable that something would go wrong and he would be wiped out. How long did it take for Hwang to lose his fortune? $30 billion in losses in a single week, wiped out not just Hwang but cost the banks that had loaned him money another $10 billion.
Of course, this is the most extreme example of poor risk management, but many retirees should learn an important lesson from Archegos.
If your asset allocation is not appropriate for your risk profile and needs then a short-term market decline can spell disaster.
Consider this, stocks are the best performing traditional asset class in history, but also the most volatile.
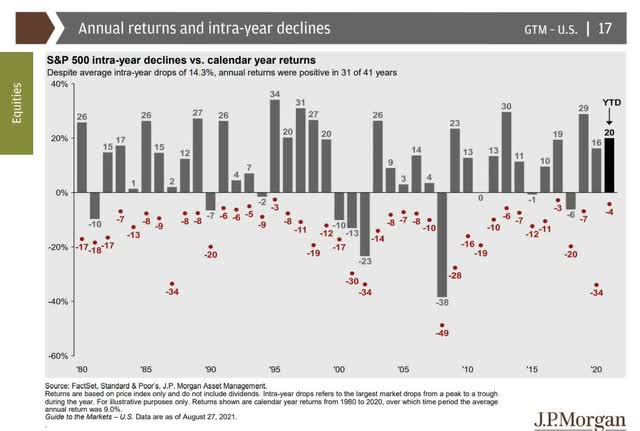
The average peak intra-year decline since 1980 has been about 14%.
If you have 100% of your money invested in stocks at all times, and you need to pay the bills in retirement or due to some unexpected expense, then that’s where you can run into trouble.
If you have an adequate emergency fund, kept outside of your portfolio, then you’ll probably be OK.
If you have sufficient cash in your portfolio to ride out a market correction, then you’ll probably be able to avoid selling stocks during a market decline.
If the market entered a prolonged bear market, which historically averages about two years from a market high to the next market high, that’s where bonds come in.

Since 1950 92% of the time stocks are falling bonds are flat or going up.
In the 8% of times when bonds and stocks are falling together, such as the global margin calls during March 2020, that’s where cash is used to meet expenses without having to sell other assets at a loss.
- emergency fund (not in your portfolio) gets spend first
- cash in your portfolio gets spent to meet expenses during pullbacks/corrections (which historically average 1 to 8 months)
- bonds are used to pay expenses during bear markets
- stocks are owned for income and capital gains and should almost never be sold during downturns if your asset allocation is right for your specific risk profile
This is why the first step to building a sleep-well-at-night retirement portfolio is the right asset allocation for your needs.
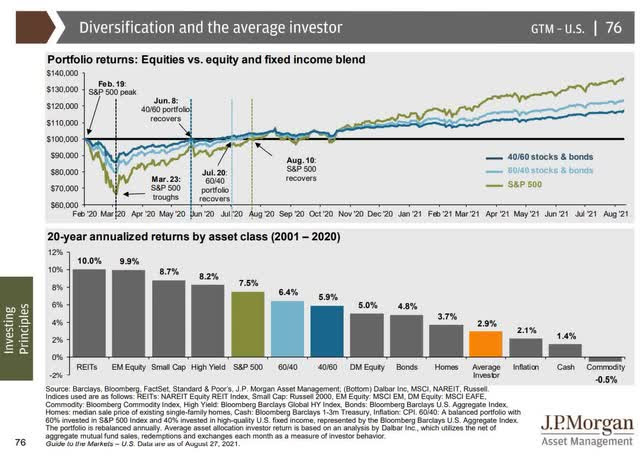
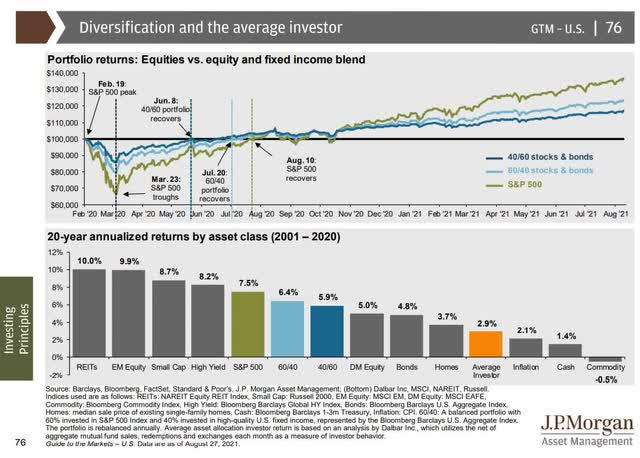
From 2001 through 2020 the S&P returned 7.5% CAGR. The average retail investor only achieved a 2.9% return, barely above the rate of inflation.
Why is that? Because according to JPMorgan, the average investor tends to be a very poor market timer and gives into greed and fear.
When stocks are roaring, it’s tempting to ignore risk-management discipline and just let stocks become a steadily larger part of your portfolio.
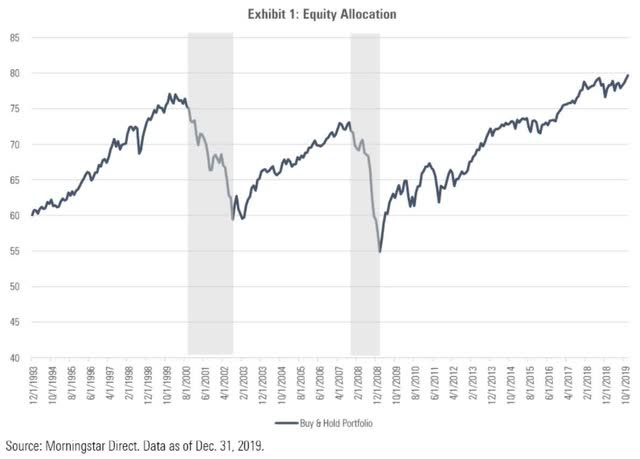
Here’s how a 60/40 stock/bond retirement portfolio’s stock exposure changed over time without any rebalancing.
By the end of 2019, it was 80% stocks and because stocks are the best performing asset class in history, eventually it could hit 85%, 90%, or even 95% given enough time.
Annual Rebalancing Is Historically The Optimal Strategy For Most Investors
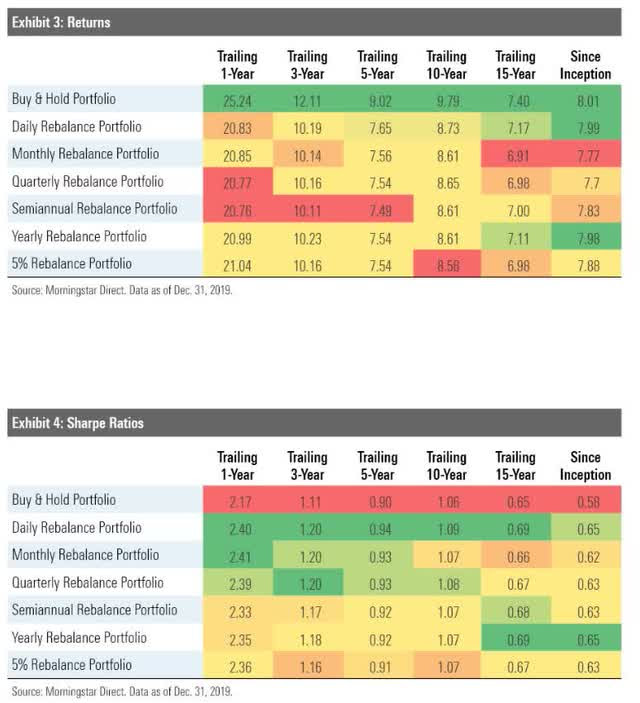
Historically, the best volatility-adjusted returns, after taxes, come from rebalancing your portfolio once per year.
There’s nothing wrong with volatility on its own.
Basically, price fluctuations have only one significant meaning for the true investor.
They provide him with an opportunity to buy wisely when prices fall sharply and to sell wisely when they advance a great deal.” – Benjamin Graham
Volatility has zero effect on intrinsic value which is always a function of sales, earnings, cash flow, and dividends.
The great investor is the one who is able to remain disciplined and thus “greedy when others are fearful”.
However, we’re only human, and if a 20% market decline such as we saw in December 2018 causes you to panic sell near the bottom? Or panic sell during the March 2020 crash? Well, that’s how you earn 2.9% annual returns for 20 years while the market delivers nearly 3X that amount.
Notice how a 60/40 or even 40/60 portfolio over the last 20 years delivered far better returns than the average investor saw with stocks.
Here’s that JPMorgan chart again, so you can see the power of prudent risk management and proper asset allocation over time.
A 40/60 stock/bond portfolio saw 5.9% returns, 3% more than the average retail investor actually experienced.
That’s the power of trusting risk management and not market timing during the market’s frequent and inevitable downturns.
The simple fact is that while the US is not likely to default on its debt this time, the closer we get to default, the more nervous the market will become.
And that simple fact, that rich people could lose $4.5 to $9 trillion on paper even without a catastrophe, is why we’re likely to avoid another Great Recession and a $15 trillion market wipeout.
But that’s only if you are able to trust your portfolio’s overall risk management and take advantage of plunging stock prices during a 10% to 20% correction that wakes Congress up and gets them to do their job.
What if you don’t have any savings to invest? Well, then it’s very simple. You should stop watching the market and trust your overall portfolio’s design and risk management and just walk away until the debt ceiling crisis is over.
SPY shares were trading at $428.24 per share on Friday morning, down $0.90 (-0.21%). Year-to-date, SPY has gained 15.66%, versus a % rise in the benchmark S&P 500 index during the same period.
About the Author: Adam Galas

Adam has spent years as a writer for The Motley Fool, Simply Safe Dividends, Seeking Alpha, and Dividend Sensei. His goal is to help people learn how to harness the power of dividend growth investing. Learn more about Adam’s background, along with links to his most recent articles. More...
More Resources for the Stocks in this Article
| Ticker | POWR Rating | Industry Rank | Rank in Industry |
| SPY | Get Rating | Get Rating | Get Rating |


