Campaign 2020 is now in full swing and politicians on both sides of the aisle are promising the moon, sun and stars to win votes. A lot of promises are being made that could send some stocks soaring, while potentially bankrupting others.
With the S&P 500 now 8% historically overvalued, and the slowing economy causing an earnings recession, many investors are naturally nervous about how to respond to the wild claims and promises being made by the likes of President Trump, Elizabeth Warren, and Bernie Sanders.
Here are the two most important facts you need to know about 2020’s campaign season, both to avoid major losses and potentially profit handsomely from the wild hyperbole that’s likely going to get a lot worse before we know who our next president will be.
Fact One: Promises Almost Always Exceed What’s Possible in Reality
At one point 28 Democrats were running for President, the single largest primary field in US history. To stand out in such a big crowd Bernie Sanders and Elizabeth Warren have been promising a lot of “free” stuff, including Medicare-for-All, and a government jobs guarantee. They’ve claimed that strong tax hikes on corporations, rich people and capital gains and dividends can pay for all these goodies.
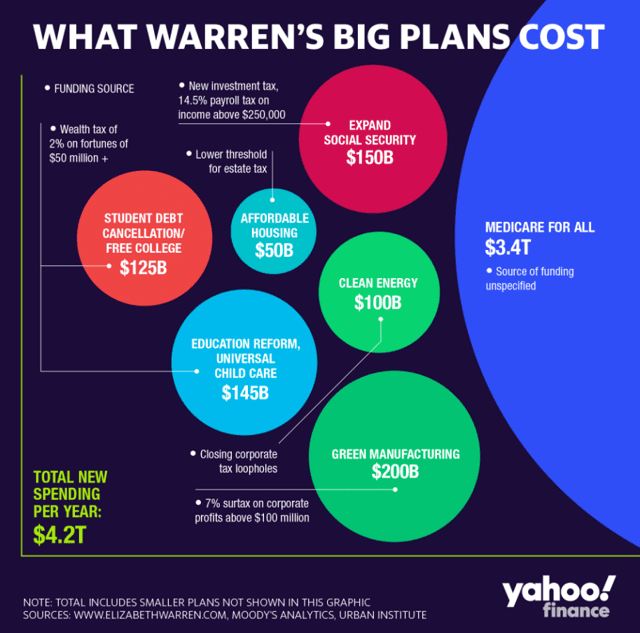
Yahoo Finance and Moody’s have crunched the numbers and determined that Warren’s various proposals would cost $4.2 trillion…per year. That would effectively double the Federal Government’s budget. Since government programs almost always end up costing far more than initially anticipated, it’s likely that $4.2 trillion per year is a conservative estimate.
Mr. Sander’s plan is even more ambitious. Here’s the approximate 10-year cost, as estimated by the City Journal, which has been keeping a running tally of all his proposals.
- Medicare-For-All: Sanders himself admits “somewhere between $30 and $40 trillion over a 10-year period.”
- climate change plan: $16.3 trillion
- government jobs program ($15 per hour plus benefits for anyone who wants a government job): $30.1 trillion
- forgiving student loans + free college tuition: $3 trillion
- expanding social security benefits: $1.8 trillion
- housing subsidies: $2.5 trillion
- paid family leave subsidies: $1.6 trillion
- new infrastructure: $1 trillion
- increased K-12 education: $800 billion
- increased pay for teachers (Federal government doesn’t set teacher pay): $400 billion
- Total cost: $97.5 trillion = $9.75 trillion per year
Sander’s proposals would triple the budget and cause government spending to hit 70% of GDP, far above the 50% to 57% seen in Nordic countries. Government spending in the average OECD country is 43%.
Sander’s plan would cause the 10-year budget deficit to rise from $15.5 trillion (already very high) to an absurd $113 trillion. His various tax hike proposals would raise $26 trillion.
Under Sander’s plan payroll taxes would rise to 27.2% from 15.3%, and investment taxes on the highest tax bracket would soar from 23.4% to 62%.
Basically, the proposals that both Warren and Sanders are making are not even close to realistic. Most of these proposals would require 60 Senate votes to get by a filibuster which neither candidate has said they want to eliminate (lest Republicans regain control and undo all their ideas).
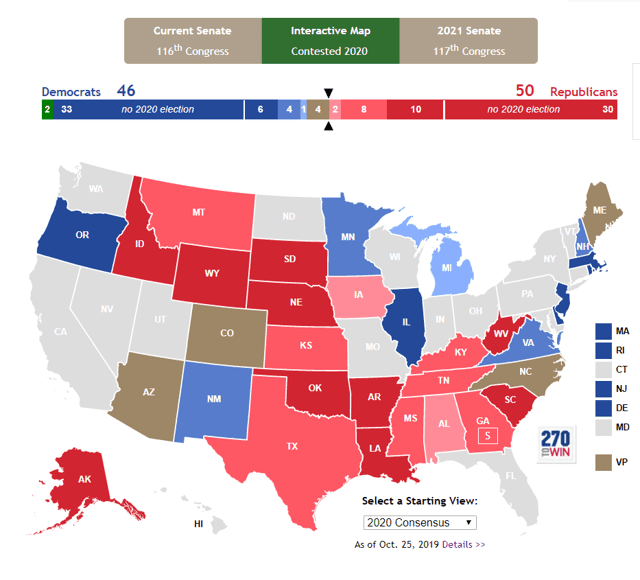
(Source: 270towin.com)
Here is the current consensus from four leading economic forecasters (like The Cook Report) about what the 2020 Senate is likely to look like. Democrats need four seats to win if Trump is re-elected and three if the Democrats regain the White House.
The current consensus estimate is that it will be a 50/50 tie in the Senate, with Democrats potentially gaining control via the VP’s tie-breaking vote. When was the last time any party had 60 senate seats? 1965. In 2009 the Affordable Care Act, aka “ObamaCare” passed with 60 votes when Sanders caucused with the Democrats and Sherrod Brown replaced a deceased GOP Massachusettes Senator.
The point is that almost all political promises have very little chance of passing. Which brings me to the most important fact of all in campaign seasons 2020.
Fact Two: Significant Portfolio Shifts Due To Elections Are Almost Always A Mistake
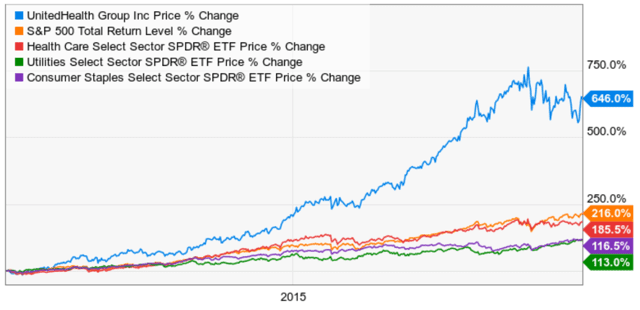
Speaking of ObamaCare, remember how that was supposed to devastate all healthcare stocks especially health insurers like UnitedHealth Group (UNH)?
(Source: Ycharts)
Healthcare stocks did underperform the tech-heavy S&P 500 (23% tech) but outperformed defensive sectors like utilities and consumer staples. UNH smashed the broader market and even the Nasdaq (57% tech stocks).
United historically trades at 14 to 18 times earnings, 14 times since the ACA passed 10 years ago. Back in late March 2010, it traded at a 9.5 PE. Management managed to deliver 16% CAGR EPS growth and is offering 13% to 16% long-term EPS growth guidance that most analysts agree is reasonable. All that despite the most significant healthcare reform since the 1960s.
Here’s Morningstar’s Damien Conover, explaining his company’s expectations about what campaign 2020 will mean for healthcare companies.
We expect concerns around healthcare reform to pick up over the coming quarters as the 2020 election cycle begins to unfold…We maintain that large-scale disruption is a low-probability event and think a more likely outcome would include private service providers playing a role in any policy solution to the nation’s rising cost of healthcare.” – Morningstar
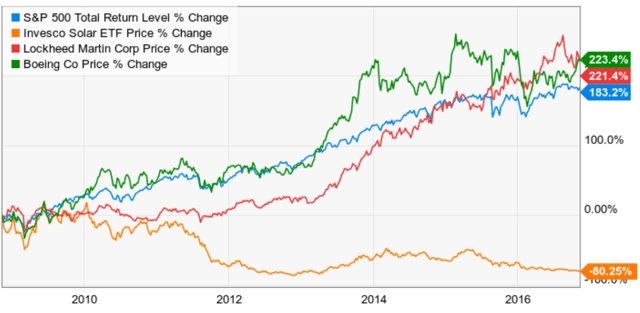
Another good example of how “obvious” political motivated stock trades is renewable energy stocks and defense contractors. President Obama was supposed to be bad for defense contracts like Boeing (BA) and Lockheed (LMT) and be great for solar stocks.
Defense Contractors And Solar Stocks During Obama Years
(Source: Ycharts)
During the Obama years, defense contractors did just fine, with most big names matching or beating the red hot S&P 500. Solar stocks got crushed, due to massive supply growth out of China that bankrupted many solar panel makers.

(Source: Ycharts)
Did solar boom under President Obama? You bet. Is solar booming under President Trump? You bet. Are solar investors making any money? Not under Obama, but yes under Trump.
Solar Generation Under Trump


(Source: Ycharts)
Coal and oil-loving President Trump’s administration has been far better for solar investors than the Obama presidency? Why? Because in 2008 investors anticipating a gold rush during the Obama years bid up solar stocks into a bubble. An 80% crash later, and anyone being “greedy when others are fearful” on solar was able to beat the market in one of the least successful industries of the last decade.
Keep this in mind when you hear analysts or pundits expound on how industry X or stock Y is going to do well or poorly under President Warren or Trump. Any ideas you hear in the coming 12 to 18 months is likely to not just be overly simplistic but could be catastrophically and painfully wrong.
Bottom Line: The Easiest Way To Profit From This Election Season Is To Opportunistically Buy Quality Companies At Attractive Prices That The Market Fears Are Going To Be Gutted By Wild Campaign Promises
The Dividend Kings (of which I’m a founder) have a very simple and time tested strategy.
- buy above-average quality dividend growth stocks
- run by competent and trustworthy management
- with good long-term growth prospects
- at reasonable or attractive valuations
- collect safe and exponentially rising dividends (in all economic and market conditions) while we wait for managment to adapt to challenges and deliver on expected growth
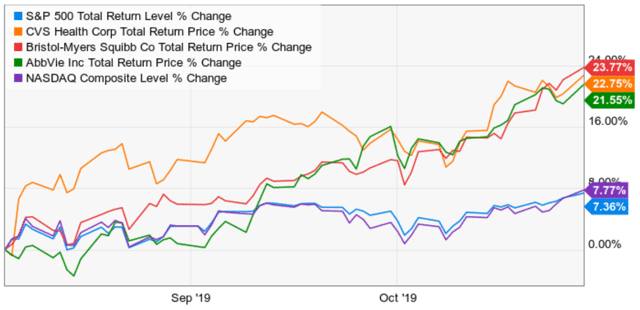
Politics doesn’t factor into our strategy, except when taking advantage of opportunistic buying opportunities in quality out of favor sectors such as healthcare we bought months ago.
Healthcare Goes From Wall Street Whipping Boy To Golden Boy
(Source: Ycharts)
Will 2020’s campaign potentially bring a lot of short-term volatility to certain sectors and companies? Probably. Will the various wild promises being made now come true? Very unlikely, given the realities of US politics and our gridlocked Congress.
(Source: imgflip)
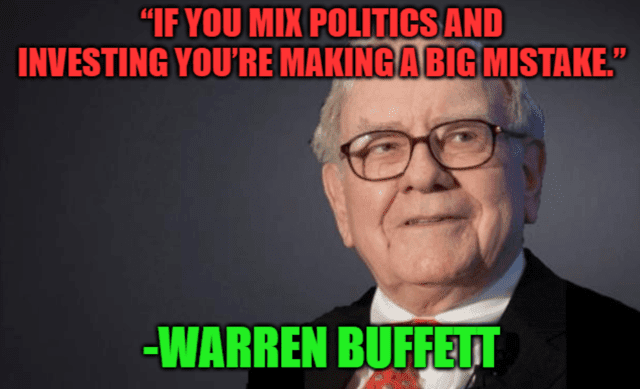
None other than Buffett, the greatest investor in history, warns investors to avoid the dangerous temptation to let your political leanings determine what’s in your portfolio. Stock prices in the long-term are a function of earnings, cash flow, and dividends, and we need to invest based on the most likely probability-weighted outcomes. Or to put another way, invest based on the world as it’s likely to be and not as you wish it to be.
SPY shares were trading at $303.09 per share on Wednesday morning, down $0.12 (-0.04%). Year-to-date, SPY has gained 22.97%, versus a 22.97% rise in the benchmark S&P 500 index during the same period.
About the Author: Adam Galas

Adam has spent years as a writer for The Motley Fool, Simply Safe Dividends, Seeking Alpha, and Dividend Sensei. His goal is to help people learn how to harness the power of dividend growth investing. Learn more about Adam’s background, along with links to his most recent articles. More...
More Resources for the Stocks in this Article
| Ticker | POWR Rating | Industry Rank | Rank in Industry |
| SPY | Get Rating | Get Rating | Get Rating |


