In part one of this series I showed why the “hopium rally” fueled by dreams of TINA/FOMO/QE Infinity might continue for several more weeks, or months.
S&P & Top Performing Phoenix Portfolio Holdings Since March 23rd Lows
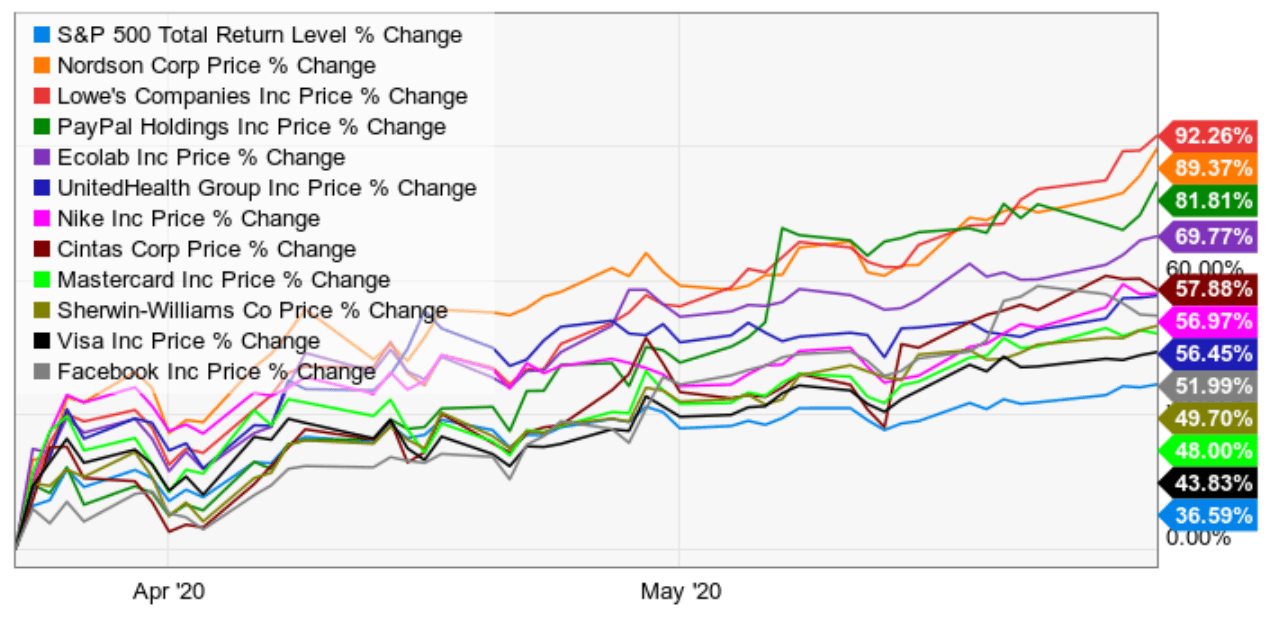
(Source: Ycharts)
I explained the numerous reasons that Stifel, JPMorgan, and Goldman Sachs gave for stocks to potentially rise by as much as 8% through August, which would make the S&P 500’s rally since March look even more impressive.
Popular growth stocks, such as what the Dividend Kings’ Phoenix portfolio bought in late March, might continue outperforming the market since they are cyclical and thus tend to do better during periods of rising economic optimism.
However, there is one big reason that the current rally, which has stocks about 11% away from new record highs that would create the shorter bear market in history, isn’t likely to persist through the end of 2020 and early 2021.
This Pandemic Is Far From Over
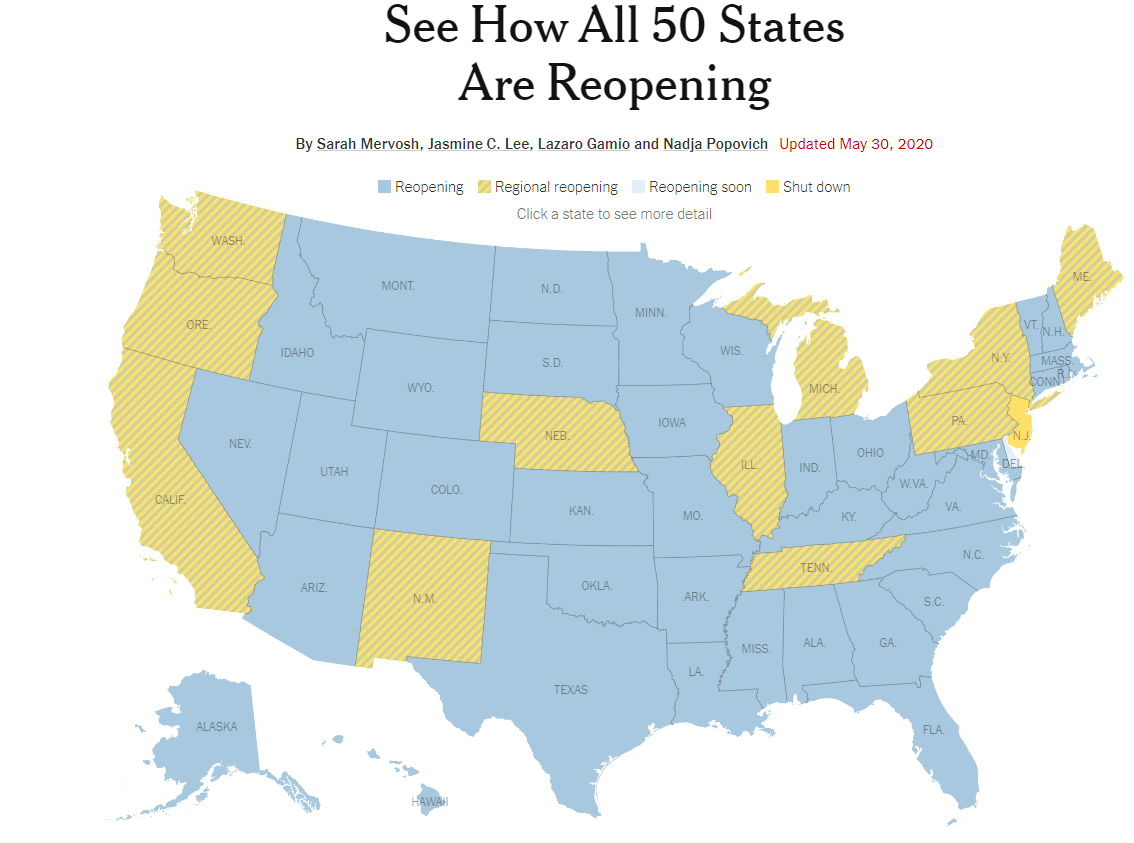
(Source: NYT state restart tracker)
By June 8th every state plans to end stay at home orders and be in phase 1 economic restart.
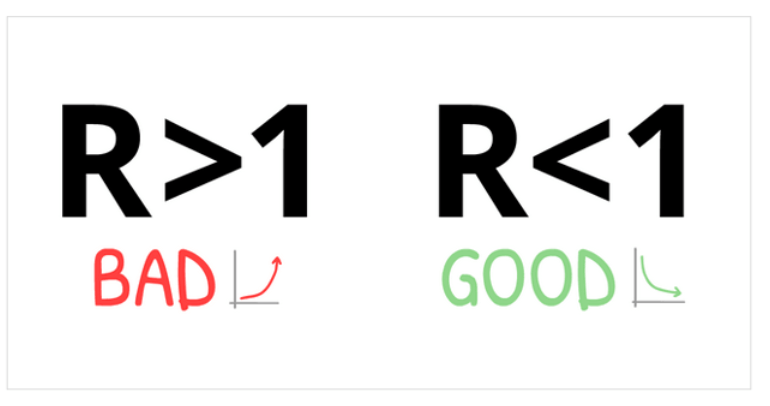
A major concern of experts like Dr. Anthony Fauci has been that reopening too soon might increase the transmission rate of the virus.
The transmission rate is how many new infections each current case generate in the future.
(Source: Jeff Miller)
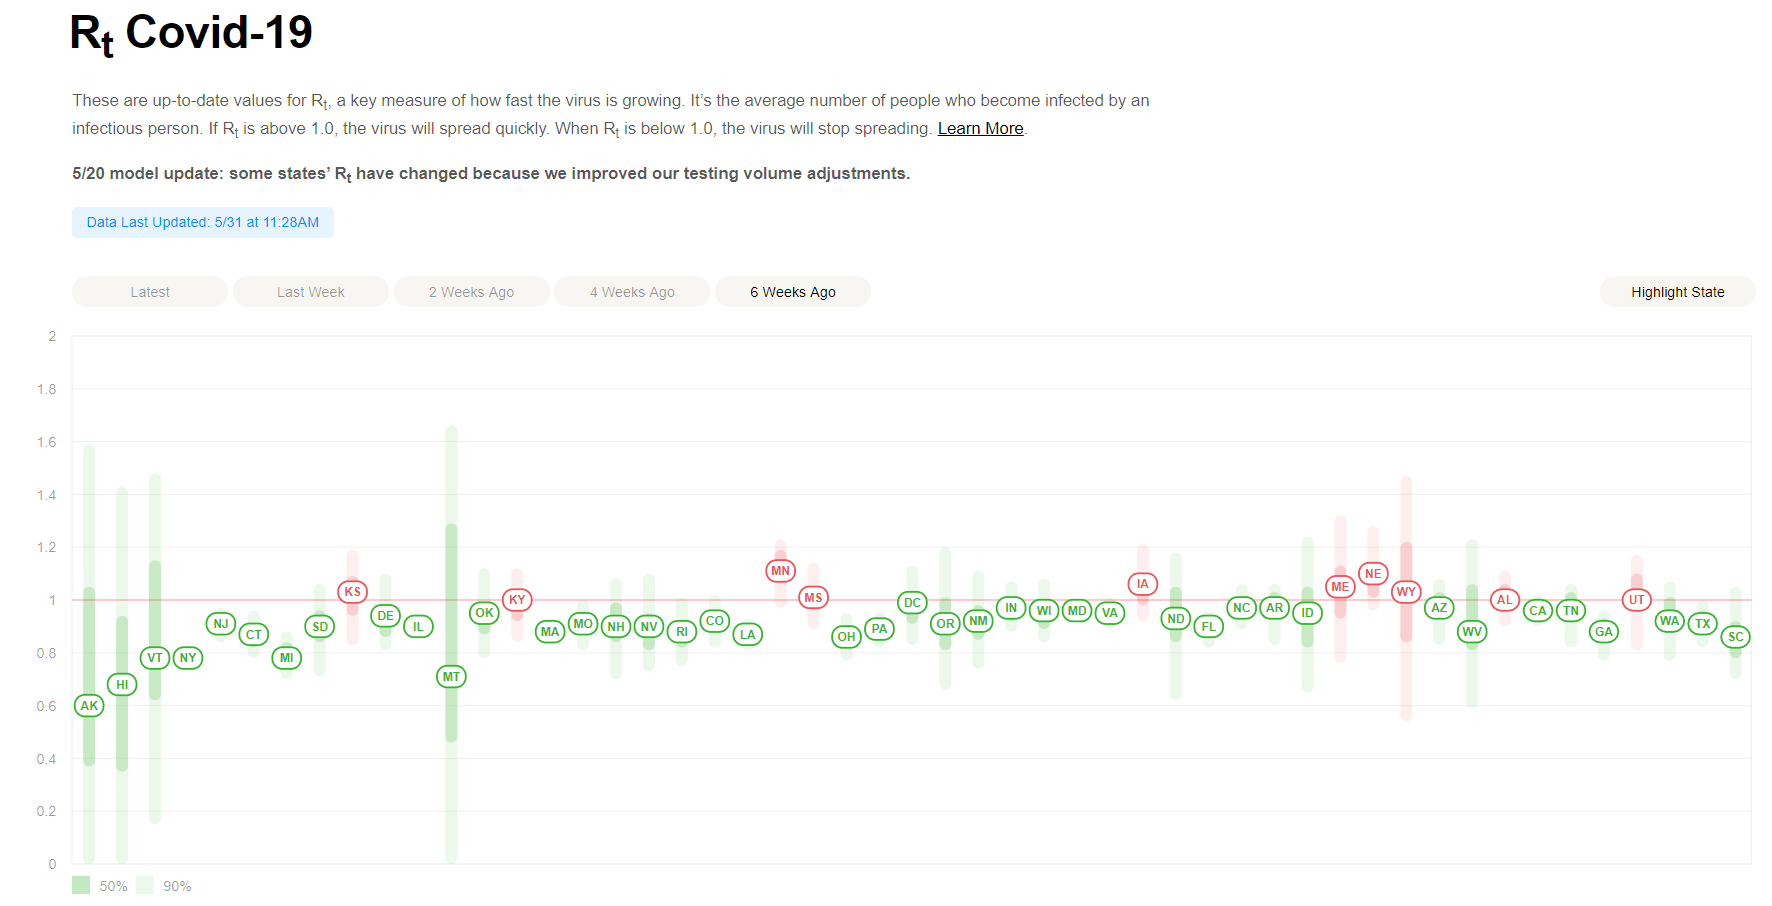
US Effective Transmission Rates 6 Weeks Ago
US Effective Transmission Rates Today
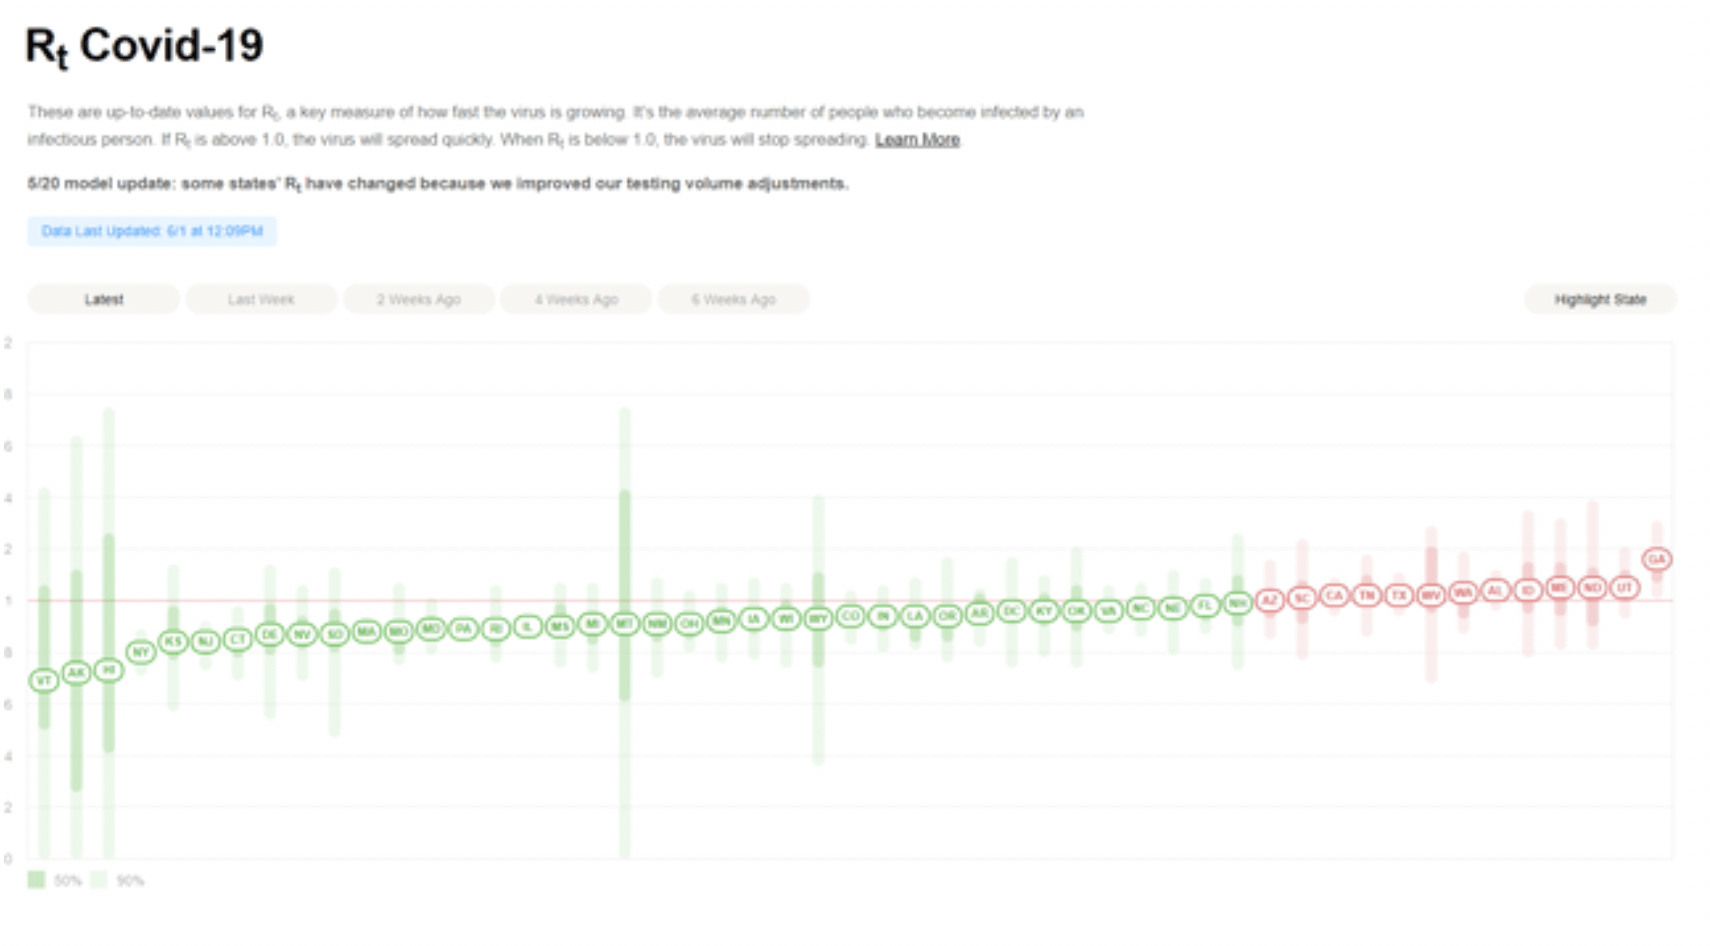
(Source: rtlive)
Reopening our economies has led to a rise in transmission rates in most states, including 13 whose Rts has now risen back to 1.0 or higher.
(Source: rtlive)
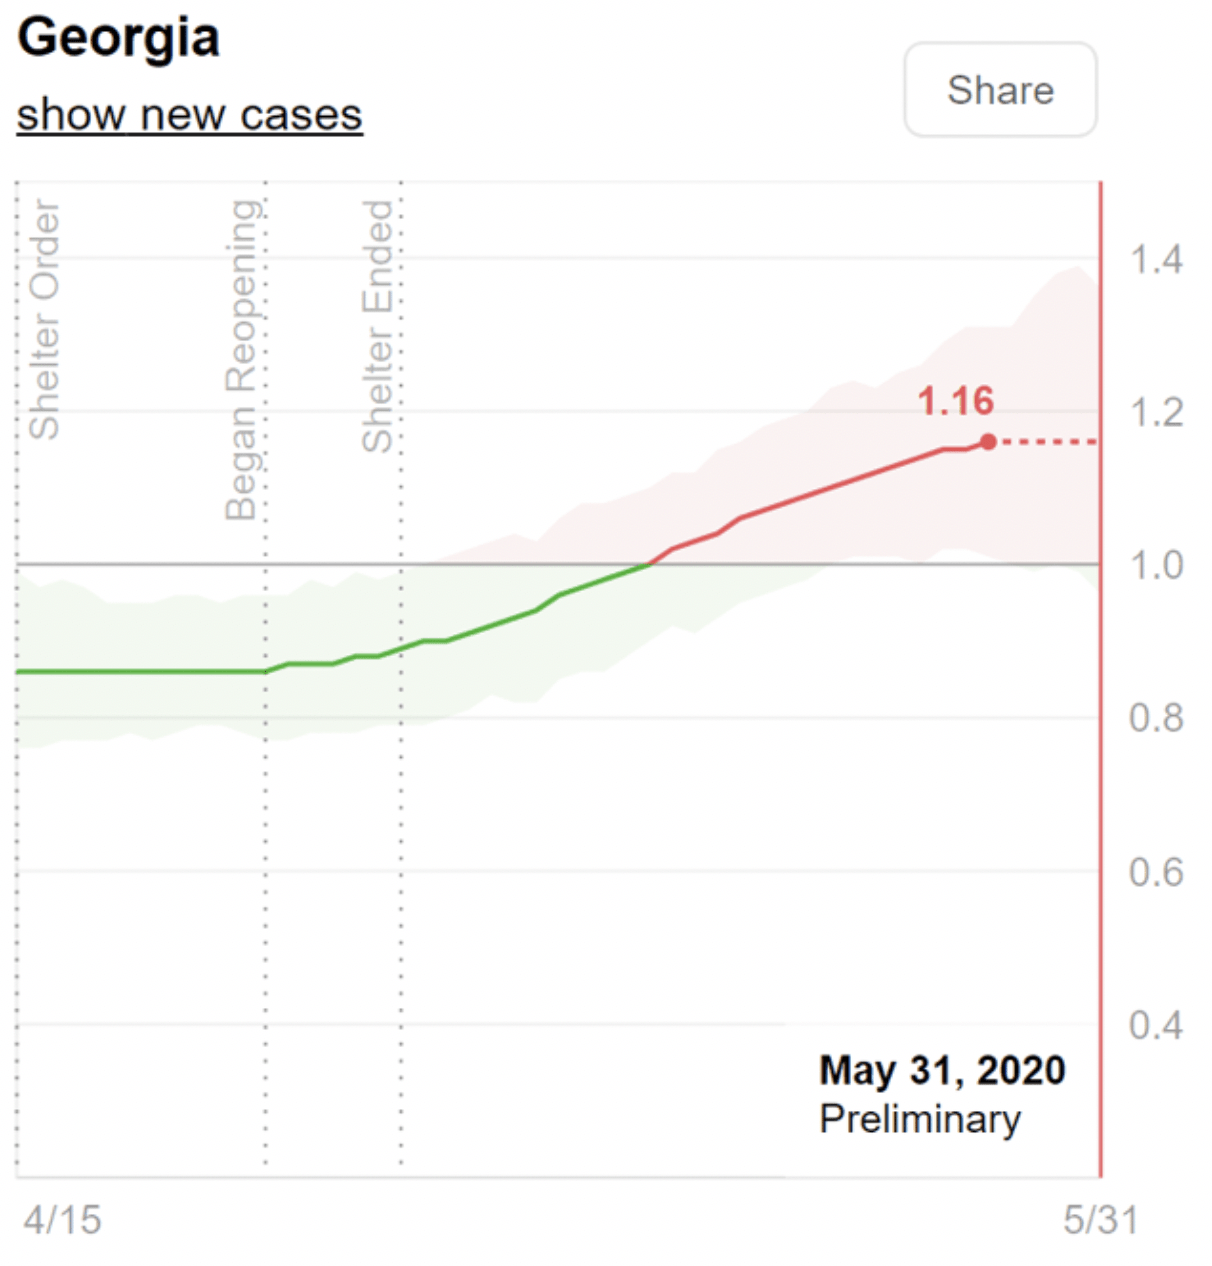
Georgia was famous for being the first state to reopen, weeks before Federal Guidelines said it was safe. Even President Trump cautioned its Governor not to lift the stay at home order on April 24th.
Georgia’s effective transmission rate, as expected has begun rising and it’s now the highest in the country at 1.16.
Does that mean that Georgia’s daily new cases are soaring and its deaths are mounting?
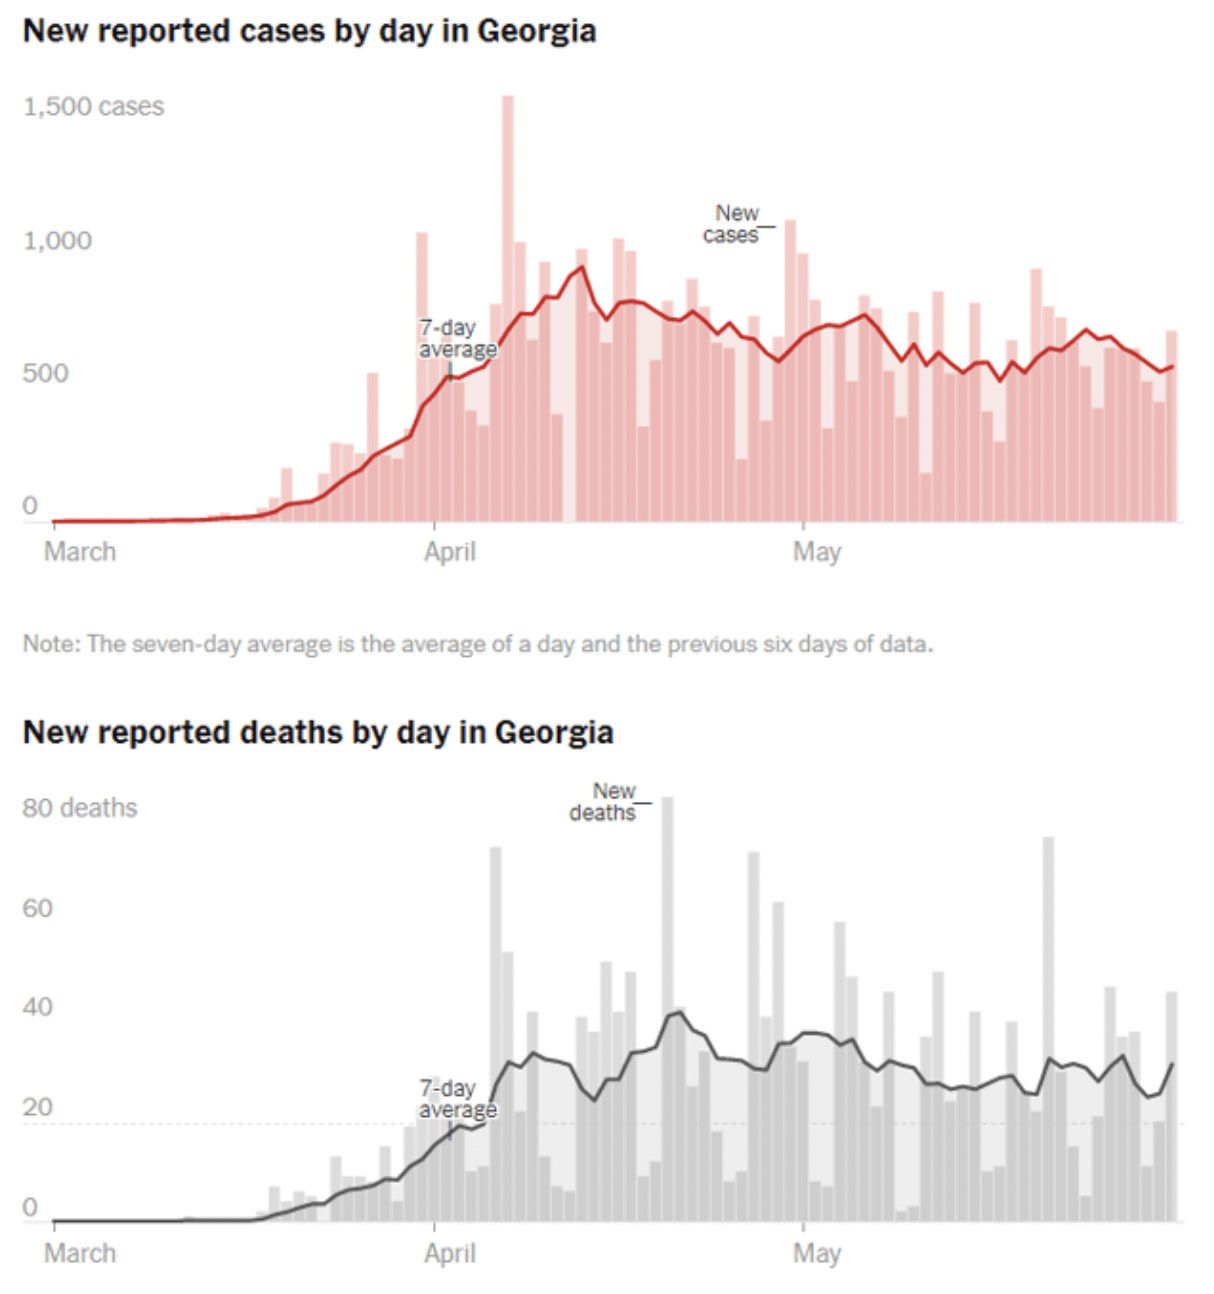
(Source: NYT)
Not yet, though it’s stuck in a long-tail plateau and the transmission rate data indicates new cases might start to rise soon.
Does this mean Georgia was wrong to reopen when it did? Will it and all US states come to regret our decisions to reopen our economies in phase 1?
Yes and no. Like most things in life, it’s complicated.
A group of researchers at the Center for Infectious Disease Research and Policy (CIDRAP) suggest that the COVID-19 outbreak won’t end until 60% to 70% of the human population is immune to the virus, which may take between 18 and 24 months.
The experts laid out three scenarios for how the coronavirus pandemic will progress. The worst-case scenario among these three projections involves a second, larger wave of infections this fall and winter. The report authors suggest this is the most likely outcome, and states need to prepare for it.
“This thing’s not going to stop until it infects 60 to 70% of people,” Michael Osterholm, report author and the director of CIDRAP, told CNN. “The idea that this is going to be done soon defies microbiology.” – Business Insider (emphasis added)
This pandemic is expected to last 24 to 30 months in total, and we’re now in month six. It’s not possible to lock down our economy for 2 to 2.5 years, as it would result in economic catastrophe from which we might not be able to ever recover.
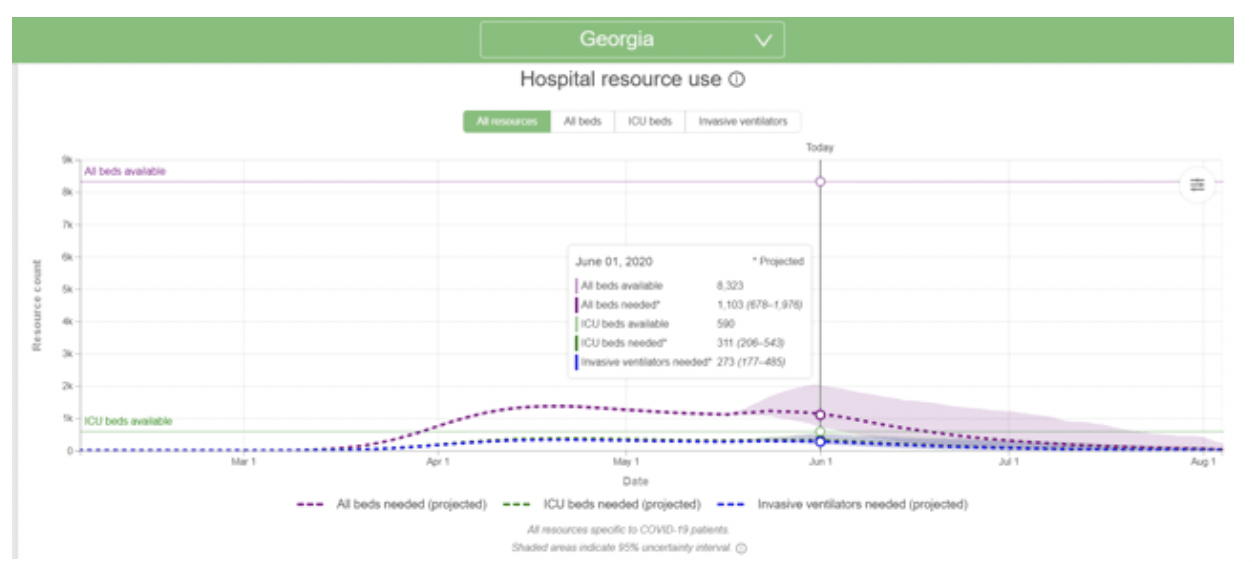
(Source: IHME)
The goal of social distancing was to bend the curve and allow medical systems to handle the severe cases that sent people to ICUs. 95% of people that need an ICU and don’t get one die.
Georgia has 590 ICU beds available and currently, 311 of those are in use. Its medical capacity is nowhere close to being maxed out and so even a sharp increase in cases might mean that reopening when it did was the correct decision.
Until we achieve 70% immunity to this virus, either through exposure or vaccination, the pandemic isn’t going to end.
And in the meantime, the lockdowns we endured in April and March have wrought a terrible price on our economy.
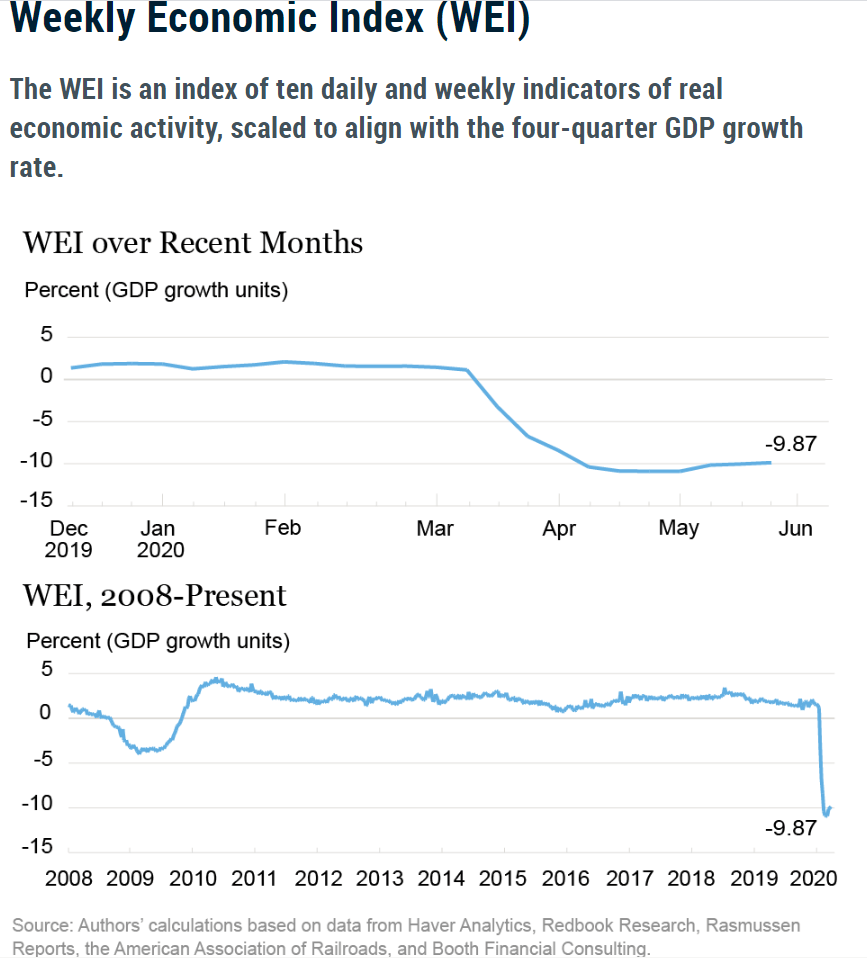
(Source: New York Fed, Dallas Fed, Harvard)
We bottomed at -48% annualized GDP growth a few weeks ago, and are currently at -39.5%. We’re beginning to recovery slowly, as Americans start returning to stores.
| State | Rt (5/28) | Rt (5/20) | Rt (5/14) | Rt (5/7) | Rt (4/29) | Retail Mobility Data Compared To Baseline (May 21st) | Retail Mobility Data Compared To Baseline (May 14th) | Retail Mobility Data Compared To Baseline (April) | Increased Retail Mobility Since April |
| Hawaii | 0.60 | 0.68 | 0.77 | 0.73 | 0.76 | -42% | -46% | -48% | 6% |
| Alaska | 0.72 | 0.67 | 0.73 | 0.78 | 0.70 | -3% | -7% | -16% | 13% |
| Vermont | 0.77 | 0.67 | 0.69 | 0.82 | 0.80 | -19% | -37% | -43% | 24% |
| New York | 0.80 | 0.83 | 0.79 | 0.79 | 0.83 | -42% | -47% | -58% | 16% |
| New Jersey | 0.83 | 0.91 | 0.72 | 0.93 | 0.84 | -49% | -45% | -56% | 7% |
| Connecticut | 0.86 | 0.85 | 0.77 | 0.81 | 0.81 | -22% | -29% | -42% | 20% |
| Nevada | 0.86 | 0.84 | 0.83 | 0.91 | 0.94 | -24% | -36% | -36% | 12% |
| Kansas | 0.87 | 0.90 | 0.95 | 1.00 | 1.02 | -12% | -25% | -24% | 12% |
| South Dakota | 0.88 | 0.91 | 0.93 | 0.94 | 0.99 | -4% | -19% | -17% | 13% |
| New Hampshire | 0.89 | 0.90 | 0.92 | 0.91 | 0.96 | -8% | -25% | -35% | 27% |
| Georgia | 0.89 | 0.83 | 0.81 | 0.86 | 0.81 | -13% | -20% | -23% | 10% |
| New Mexico | 0.89 | 0.92 | 0.89 | 0.93 | 0.87 | -16% | -31% | -25% | 9% |
| Deleware | 0.89 | 0.89 | 0.91 | 0.98 | 0.95 | -21% | -29% | -38% | 17% |
| Pennsylvania | 0.89 | 0.88 | 0.89 | 0.91 | 0.91 | -24% | -34% | -32% | 8% |
| Missouri | 0.90 | 0.85 | 0.84 | 0.87 | 0.86 | -7% | -21% | -21% | 14% |
| Rhode Island | 0.90 | 0.91 | 0.84 | 0.83 | 0.82 | -17% | -26% | -39% | 22% |
| Massachusetts | 0.90 | 0.92 | 0.82 | 0.87 | 0.86 | -30% | -39% | -47% | 17% |
| Kentucky | 0.91 | 0.91 | 0.92 | 0.99 | 0.86 | -16% | -25% | -24% | 8% |
| Illinois | 0.91 | 0.91 | 0.89 | 0.90 | 0.90 | -29% | -35% | -35% | 6% |
| Washington DC | 0.91 | 0.90 | 0.94 | 0.93 | 0.91 | -58% | -62% | -66% | 8% |
| Indiana | 0.92 | 0.90 | 0.89 | 0.96 | 0.95 | -8% | -14% | -27% | 19% |
| Louisiana | 0.92 | 0.87 | 0.75 | 0.75 | 0.79 | -12% | -25% | -22% | 10% |
| Ohio | 0.92 | 0.93 | 0.79 | 0.82 | 0.82 | -12% | -22% | -29% | 17% |
| Michigan | 0.92 | 0.90 | 0.80 | 0.80 | 0.78 | -20% | -34% | -39% | 19% |
| Maryland | 0.92 | 0.95 | 0.96 | 0.94 | 0.90 | -26% | -32% | -44% | 18% |
| Mississippi | 0.93 | 0.99 | 0.92 | 0.94 | 0.86 | -1% | -12% | -10% | 9% |
| Wisconsin | 0.93 | 0.93 | 0.93 | 1.01 | 1.00 | -14% | -27% | -32% | 18% |
| Minnesota | 0.93 | 1.01 | 1.06 | 1.05 | 1.03 | -23% | -38% | -30% | 7% |
| Oregon | 0.93 | 0.92 | 0.94 | 0.90 | 0.88 | -24% | -36% | -41% | 17% |
| Florida | 0.93 | 0.89 | 0.89 | 0.86 | 0.89 | -26% | -32% | -40% | 14% |
| Wyoming | 0.94 | 0.95 | 1.01 | 0.98 | 1.02 | 0% | -11% | -20% | 20% |
| Montana | 0.94 | 0.78 | 0.41 | 0.74 | 0.74 | -2% | -13% | -23% | 21% |
| Nebraska | 0.94 | 0.87 | 0.99 | 1.05 | 1.09 | -14% | -24% | -22% | 8% |
| Colorado | 0.94 | 0.94 | 0.86 | 0.92 | 0.88 | -19% | -31% | -32% | 13% |
| Virginia | 0.94 | 0.93 | 0.87 | 0.92 | 0.85 | -27% | -31% | -38% | 11% |
| Oklahoma | 0.95 | 0.90 | 0.91 | 0.99 | 0.94 | -1% | -13% | -10% | 9% |
| Iowa | 0.95 | 0.86 | 0.90 | 0.98 | 1.04 | -13% | -22% | -25% | 12% |
| North Dakota | 0.96 | 1.02 | 0.94 | 0.93 | 0.89 | -3% | -20% | -24% | 21% |
| South Carolina | 0.96 | 0.85 | 0.80 | 0.81 | 0.83 | -7% | -14% | -21% | 14% |
| North Carolina | 0.96 | 0.95 | 0.84 | 0.83 | 0.84 | -25% | -25% | -29% | 4% |
| California | 0.96 | 0.92 | 0.84 | 0.84 | 0.85 | -40% | -47% | -47% | 7% |
| Arizona | 0.97 | 0.93 | 0.84 | 0.94 | 0.89 | -15% | -29% | -30% | 15% |
| Washington | 0.98 | 0.96 | 0.92 | 0.92 | 0.92 | -30% | -40% | -33% | 3% |
| Idaho | 0.99 | 0.88 | 0.96 | 0.92 | 0.79 | -2% | -16% | -22% | 20% |
| West Virginia | 0.99 | 0.88 | 0.83 | 0.89 | 0.76 | -9% | -17% | -22% | 13% |
| Texas | 0.99 | 0.93 | 0.84 | 0.79 | 0.75 | -14% | -29% | -25% | 11% |
| Utah | 1.00 | 0.99 | 0.96 | 0.95 | 0.93 | -8% | -25% | -24% | 16% |
| Maine | 1.00 | 0.99 | 0.99 | 0.94 | 0.94 | -13% | -29% | -23% | 10% |
| Arkansas | 1.01 | 0.95 | 0.90 | 0.89 | 0.86 | -2% | -16% | -8% | 6% |
| Alabama | 1.04 | 0.99 | 0.92 | 0.88 | 0.83 | -5% | -15% | -18% | 13% |
| Tennessee | 1.06 | 0.92 | 0.91 | 0.92 | 0.91 | -6% | -14% | -18% | 12% |
| Average | 0.92 | 0.90 | 0.87 | 0.90 | 0.88 | -17% | -27% | -30% | 13% |
(Source: Dividend Kings COVID-19 Tracker)
According to Google Mobility data, by May 21st Americans were going to stores 22% less than pre-pandemic. That’s compared to -40% at the height of the lockdown.
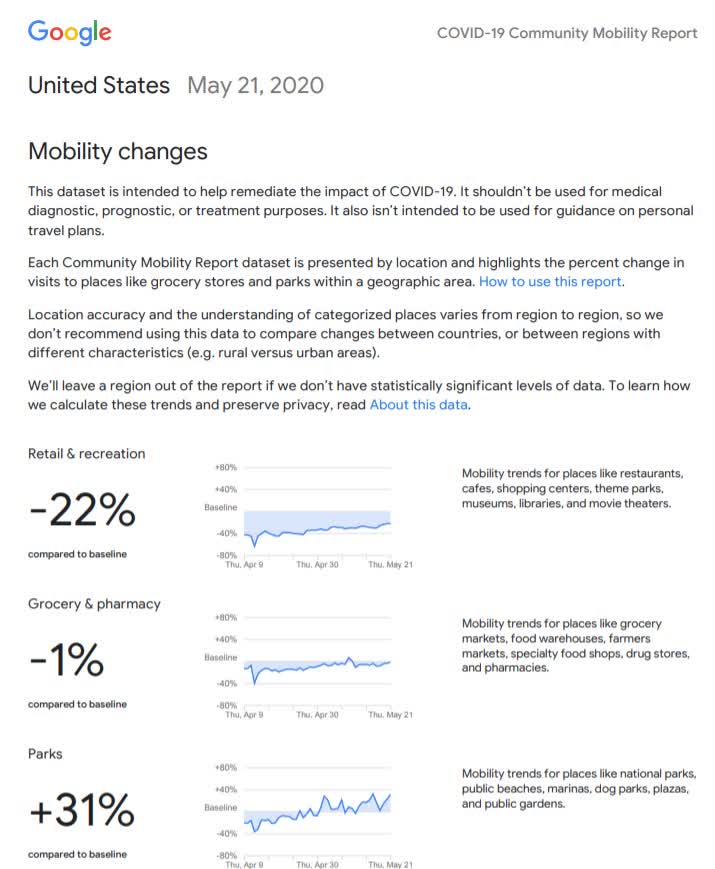
(Source: Google Mobility)
As long as we’re able to avoid overloading our critical care system, then we’ll minimize unnecessary deaths from the virus.
That has always been the goal because reducing cases to zero without a vaccine or 70% herd immunity just isn’t realistic.
However, that means that investors need to be realistic.
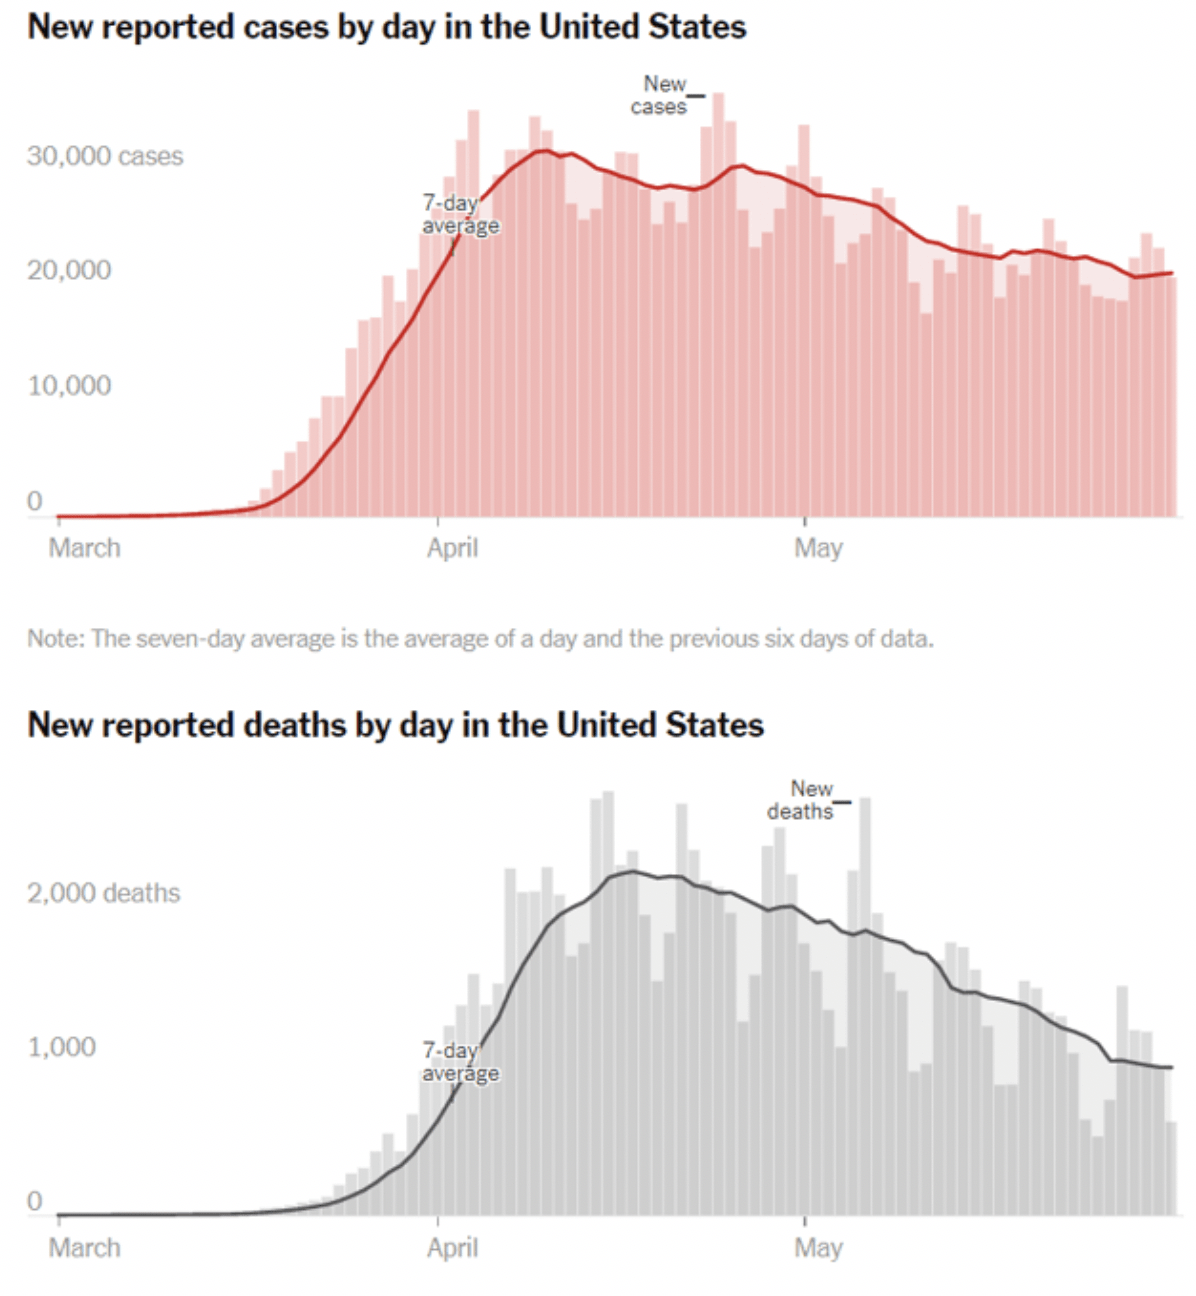
(Source: NYT)
Daily US cases have stabilized and even begun trending higher.
Similarly, deaths are running at about 1,000 per day, and reopening through phase three might require those figures to rise or at least remain stable, for the next 18 to 24 months.
What about the second wave in the fall that the CIDRAP study says is the most likely outcome? That is the single greatest threat to both the economy, millions of high-risk Americans, and the stock market.
The second wave of the Spanish flu pandemic in 1918-1919 was six times bigger than the first wave. Experts warn the COVID-19 second wave might be as much as 7X as large as the first.
That could mean we might face up to 200K daily cases in the fall or winter.
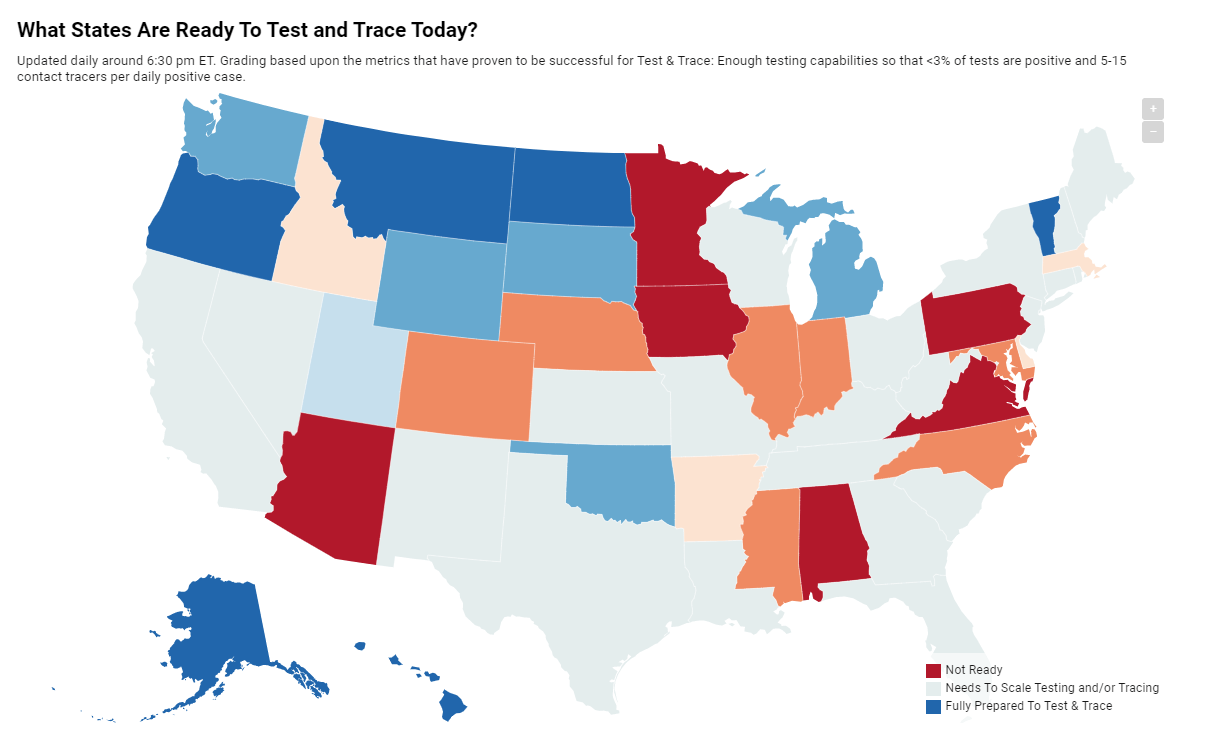
(Source: Test&trace.com)
Very few states are currently prepared for that. The expert consensus is that we need 2 to 3 million daily tests per day and 100,000 contact tracers to avoid a second wave worst-scenario.
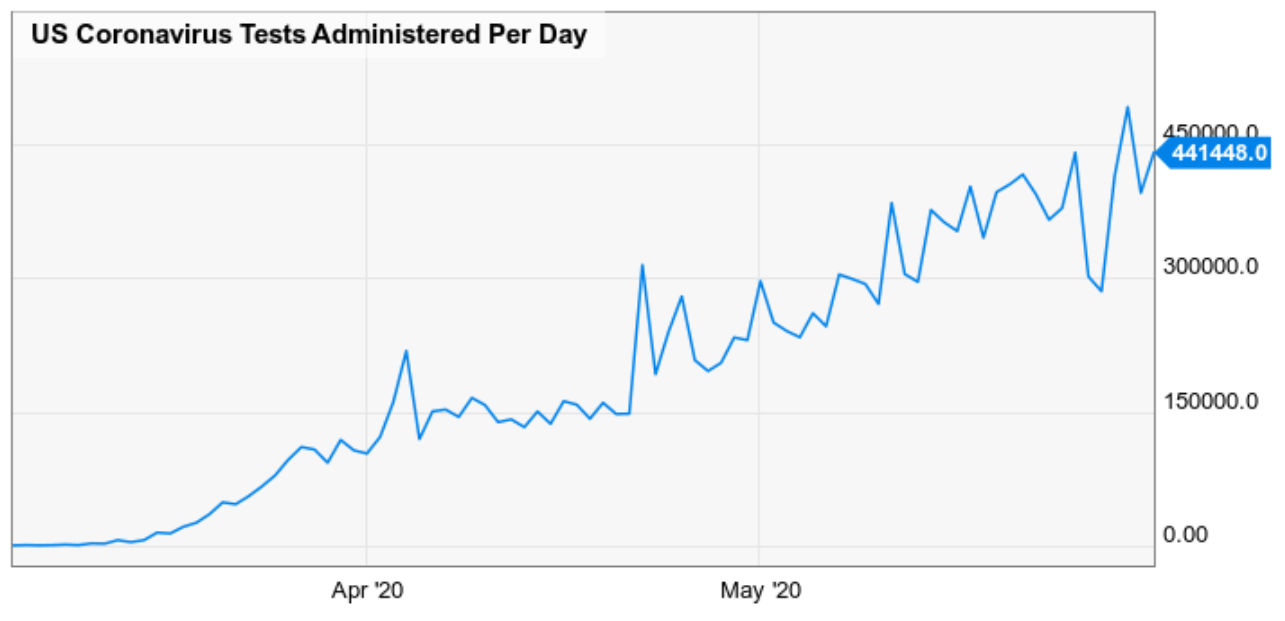
(Source: Ycharts)
We’ve made good progress on testing capacity but are a fraction of the way to what’s needed.
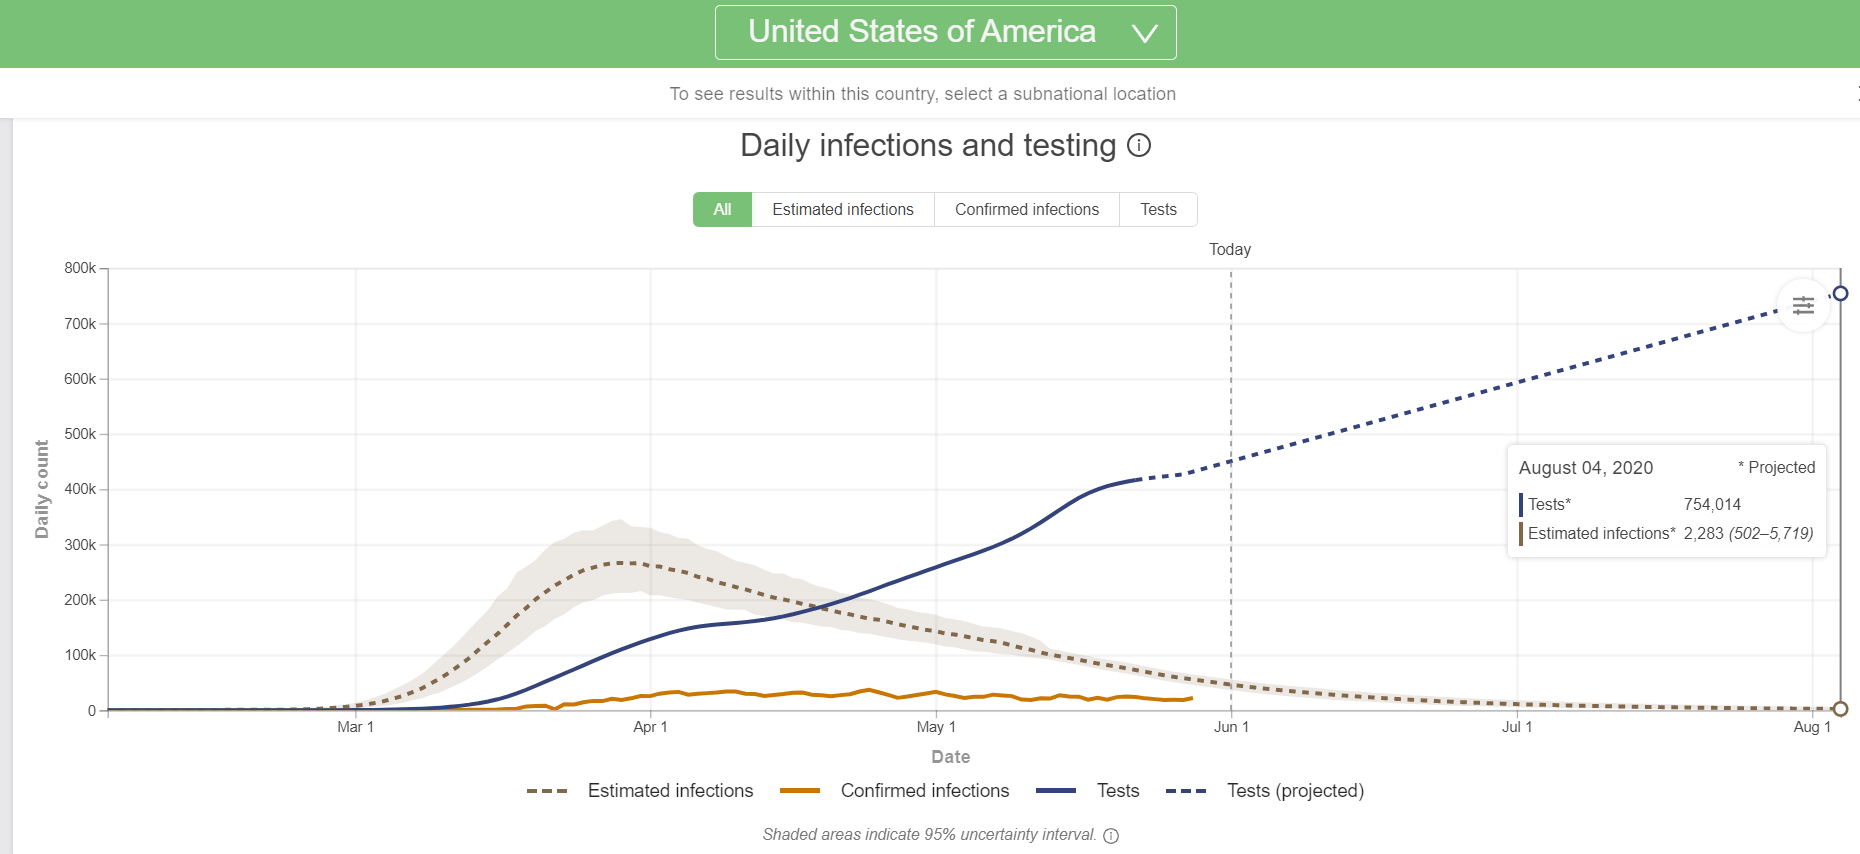
(Source: IHME)
By August 4th IHME estimates we’ll be at 754K daily tests, a fraction of what we need to prepare for the likely second wave in the fall.
During recent Congressional testimony in the Senate government officials said that we might be at 1 to 1.5 million daily testing capacity by the end of September.
September, when schools are hoping to reopen, is one of the primary catalysts that experts like Fauci and Dr. Thom Friedan (former head of the CDC) say could trigger a second wave.
Is the US ramping up medical capacity at record speed? Yes. Are we likely to be ready for a second wave that experts tell us is the base case? Probably not.
Is the stock market, currently high as a kite on “hopium” pricing in a second wave? Almost certainly not.
So what can you do to protect your retirement portfolio from a high risk of a second wave?
How To Best Protect Your Retirement Portfolio From An Inevitable Market Downturn

(Source: imgflip)
The only guarantee on Wall Street is that there are no guarantees on Wall Street.

(Source: imgflip)
Wall Street speaks three languages
- probability (never a certainty)
- risk management
- margins of safety
Avoiding becoming a forced seller, either for financial or emotional reasons is the first priority of all long-term investors.
- Focus on preservation of capital first
- then focus on a return of your capital (such as through dividends)
- only then focus on an adequate return on your capital
Think about bonds in terms of protection, not yield. The stock market becomes more important when rates are on the floor but that doesn’t mean you can forsake bonds or cash altogether…
Bonds can provide dry powder to rebalance into the stock market or pay for current expenses when the stock market inevitably goes through a nasty downturn. Bonds keep you in business even if they don’t provide high returns as they have in the past.” – Ben Carlson (emphasis original)
Stocks are the best performing asset class in history, which means that if you just leave a 60/40 stock/bond balanced portfolio alone, eventually stocks will come to dominate your assets.
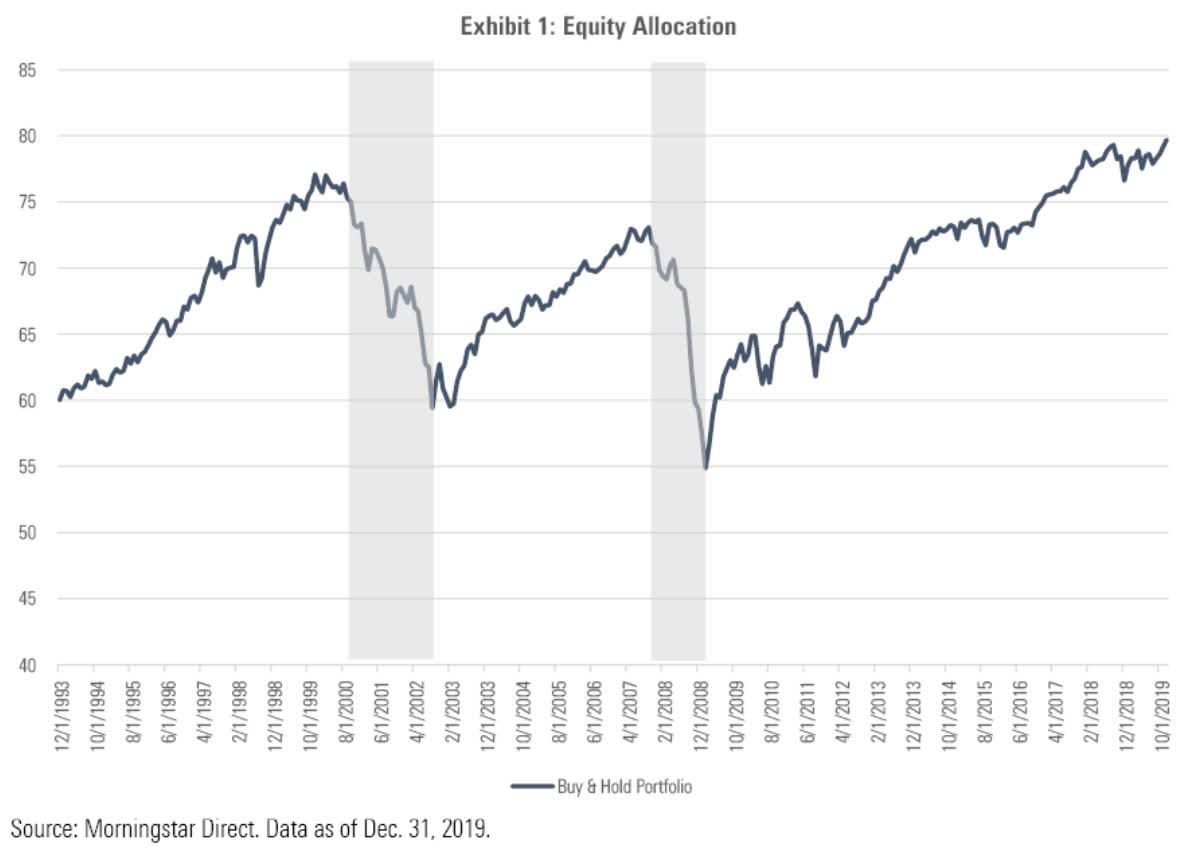
That feels great during a bull market, not so much during a bear market.
After your emergency fund (studies indicate 1 month of income is prudent for most people), cash is what you can use to fund expenses during a bear market.
Those can last as long as seven years, which is why a reasonable allocation to bonds is useful.
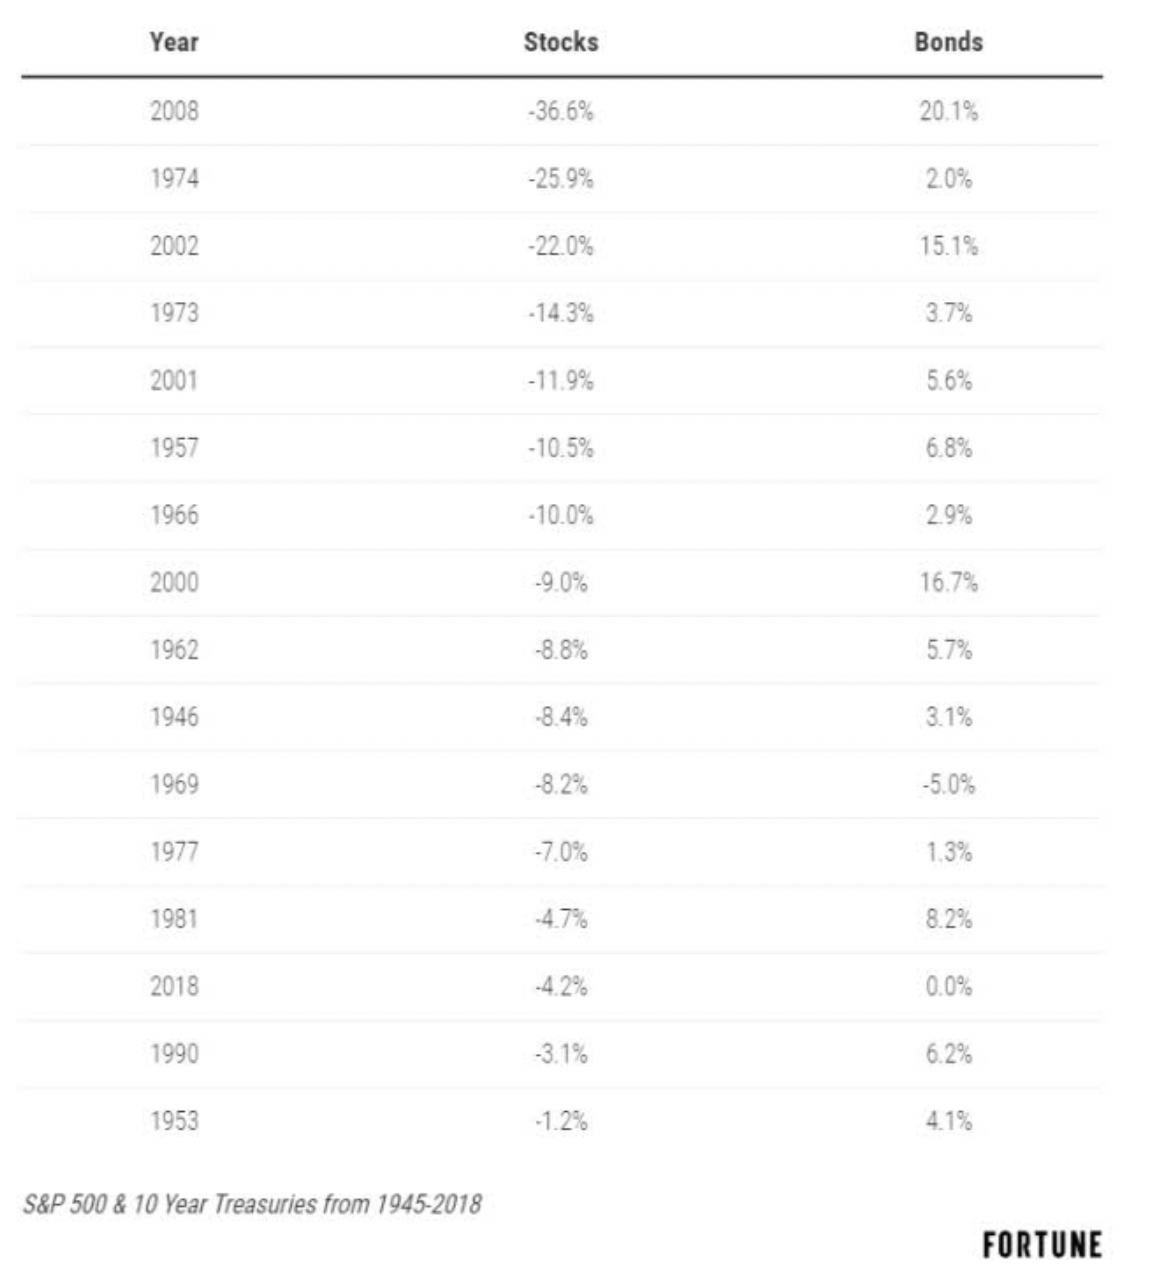
Since 1945 in 92% of years when stocks fall, bonds are stable or appreciate in value. Such is the benefit of non-correlated assets.
(Source: Duke University)
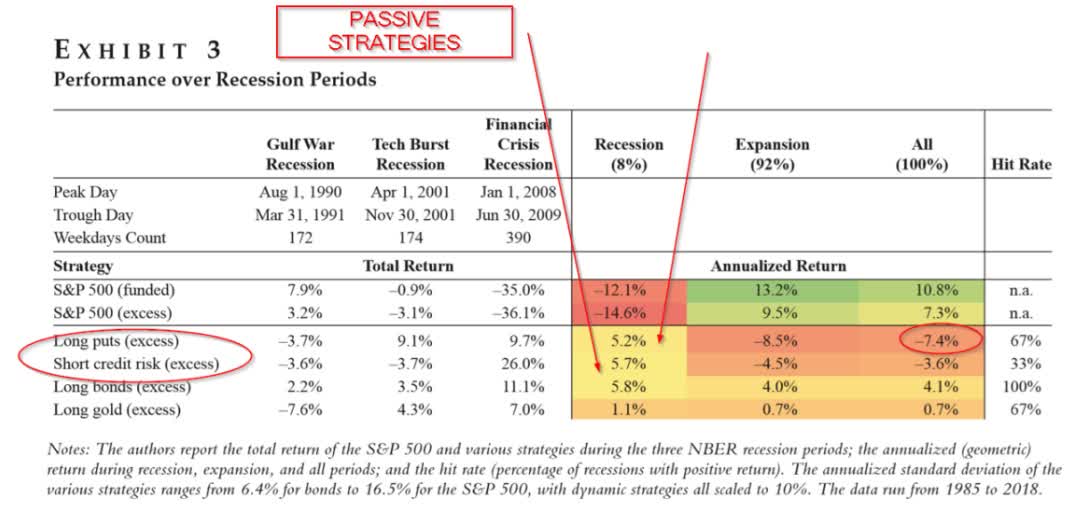
Long bonds are the best passive strategy for long-term hedging your portfolio against recessions while generating positive returns over time.
Future returns on bonds are likely to be lower, though still positive, which is why a reasonable allocation to bonds remains prudent for most people.
(Source: Ben Carlson)
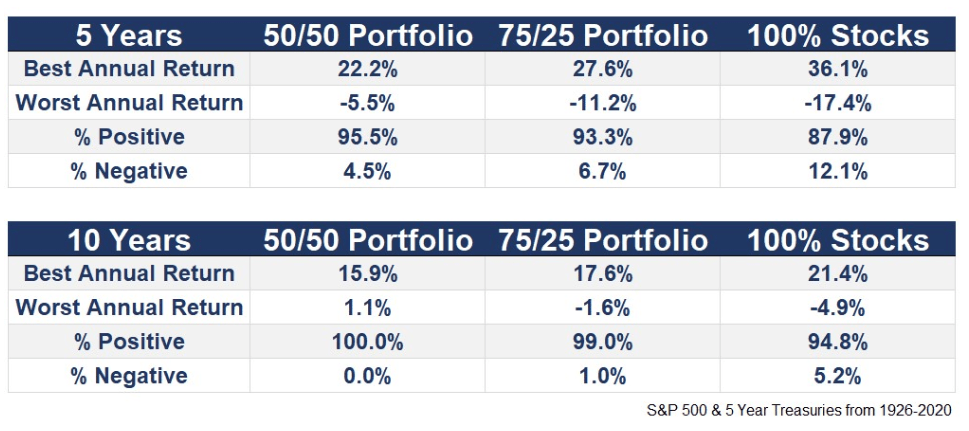
The asset mix that’s right for you will depend on your risk profile, and involve your time horizon, and personal financial situation.
Historical data can provide a useful guidepost for thinking about what asset allocations are likely to meet your needs.
Since 1926 we’ve suffered a decade long depression, inflation in the double-digits, and three “lost decades” in stocks. While we can’t know what economic, inflation conditions await us in the future, it’s reasonable to assume the conditions will likely be within the extreme conditions we’ve faced in the past 94 years.

(Source: imgflip)
Without a crystal ball, we can’t know the perfect asset allocation for our retirement portfolios.
Fortunately, we don’t need perfection, merely a sensible plan that is likely to achieve our goals that we can stick to in a disciplined fashion.

(Source: imgflip)
Which brings me to the hopium rally and rebalancing.
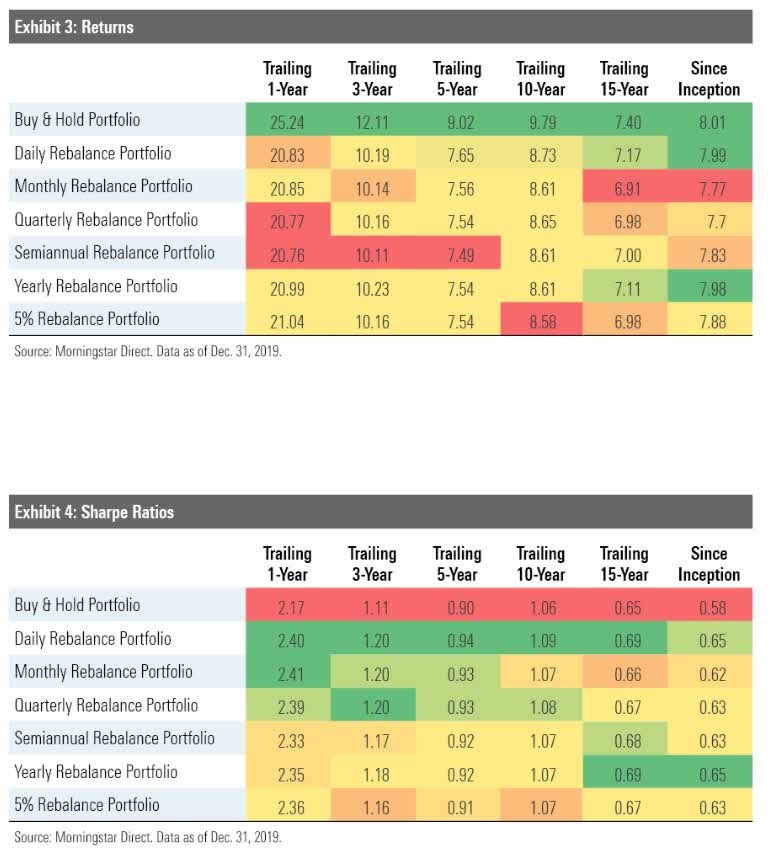
From 1994 to 2019 annual rebalancing was the optimal strategy for a 60/40 balanced portfolio. Both in terms of absolute returns and volatility-adjusted returns (Sharpe ratio). It was also the most tax-efficient.
I normally rebalance my portfolio each December. But you can avoid the temptation to overtrade by rebalancing at any time of the year, and rebalance just once per year.
Think back to March 23rd, 2020, the bear market low (so far).
Where you stressing out over your portfolio and losing sleep? If you were tempted to sell quality stocks, bought at reasonable to attractive valuations, just because they were falling, then your equity exposure is too high.
In the event of a second wave correction, or merely a run of the mill normal correction, you could be tempted to make costly mistakes, like locking in paper losses unnecessarily.
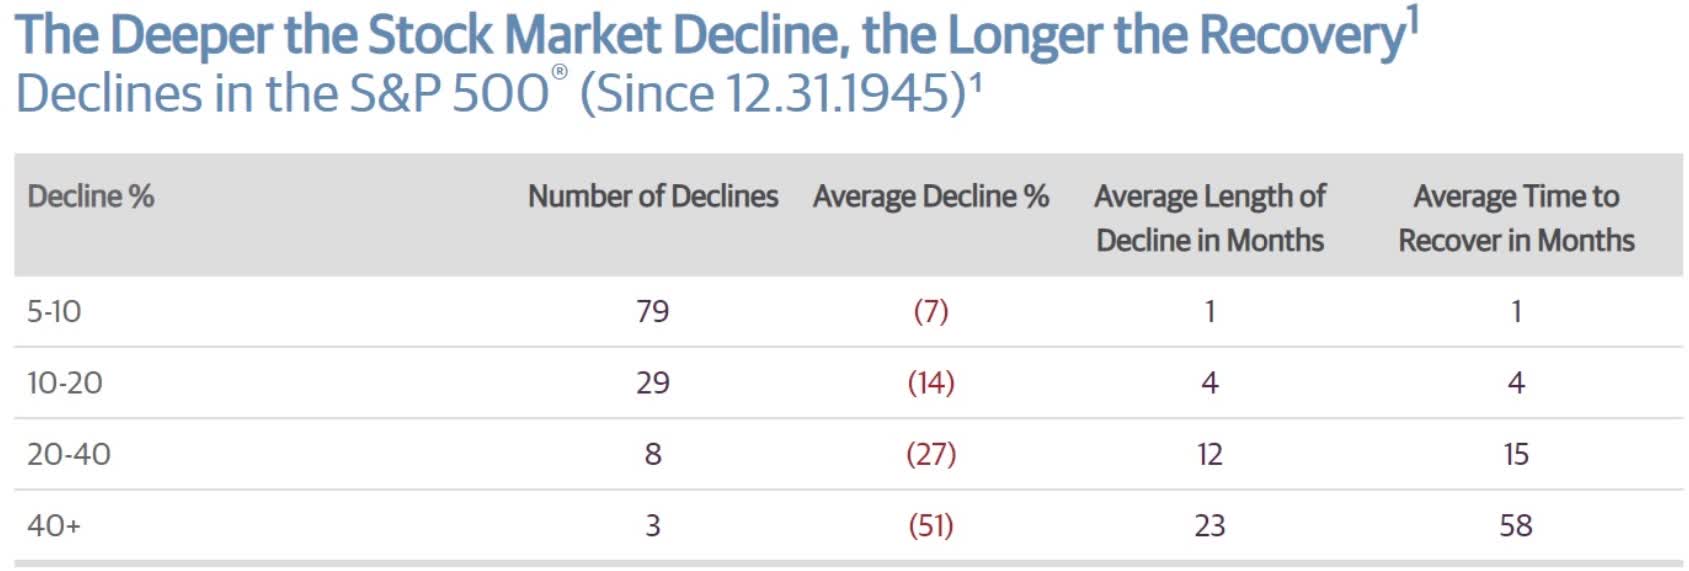
(Source: Guggenheim Partners, Ned Davis Research)
Since 1945 stocks have fallen by at least 5% every six months on average. Corrections of 10% to 19% occur every 2.5 years on average.
They tend to be mild, short and stocks recover to record highs within 2 months, and eight months, respectively.
My point is that while I can’t tell you when a market downturn is coming, it’s a certainty that one is coming at some point. The likely second wave in the fall/winter is merely the most likely catalyst to flip the market from greed to fear mode.
This means that rebalancing your portfolio during this hopium rally when many companies are trading at nosebleed valuations and adjusting your asset allocation to a more appropriate level, could be the most reasonable and prudent decision you make to protect your nest egg.
Want More Great Investing Ideas?
9 “BUY THE DIP” Growth Stocks for 2020
Bull Market or Bull S#*t? How to trade today’s stock market bubble and prepare for the return of the bear market.
7 “Safe-Haven” Dividend Stocks for Turbulent Times
SPY shares were trading at $310.77 per share on Thursday afternoon, down $1.41 (-0.45%). Year-to-date, SPY has declined -2.88%, versus a % rise in the benchmark S&P 500 index during the same period.
About the Author: Adam Galas

Adam has spent years as a writer for The Motley Fool, Simply Safe Dividends, Seeking Alpha, and Dividend Sensei. His goal is to help people learn how to harness the power of dividend growth investing. Learn more about Adam’s background, along with links to his most recent articles. More...
More Resources for the Stocks in this Article
| Ticker | POWR Rating | Industry Rank | Rank in Industry |
| SPY | Get Rating | Get Rating | Get Rating |