

(Please enjoy this updated version of this week’s commentary from the Reitmeister Total Return newsletter).
The main theme this week is explaining why so much of the current economic data is giving investors a false illusion of how well the economy is rebounding. And some of these false positives are behind stocks getting to such lofty levels. And why, when the FULL and TRUE understanding of this data comes to light that stocks will most likely tumble back down into bear territory.
Market Commentary
This story has to start with a previous conversation that we focused on a month ago with the June RTR Members Only Webinar (19 minutes and 40 seconds in).
That conversation revolves around the long time traders wisdom of “Less Bad is Good”. I then gave an abbreviated version of this in the subsequent 6/3/20 weekly commentary that is as follows:
“Your typical recession is over a long period of time where there is a vicious cycle of activity that makes the economy grind lower and lower (which is why share prices grind lower and lower over a long period of time). Therefore any improvement in the data, like #s being less bad that before, is considered a sign of recovery. These are the signals that many investors use to see the end of the recession and eventual rise of the next expansion causing a bull market to emerge.
That logic doesn’t hold well this time around. Because our economy was SHUT DOWN for 3 months because of the virus and shelter in place laws. So any re-opening of the economy will look “less bad” than a shutdown economy. But what is on the other side of the re-opening is the problem.
Meaning that after the pent up demand from the last 3 months is flushed through the economy things will start looking south once again. That is because we still have WAY TOO MANY unemployed people. And too many others fearful of losing their job. This leads to lower spending which is recessionary. And the downward vicious cycle continues lower from there. (lower spending > lower corporate profits > cost cutting > more job loss > lower spending and the cycle continues to some future lower bottom).
Unfortunately too many investors are falsely clinging to the historical precedent of “less bad is good” that it may take 2-3 months for the rest of the investment world to see the economic cliff on the other side of this re-opening. Until then we have to play ball with the bulls for a while.”
OK, that commentary from a month ago is a good primer for today’s conversation where indeed investors are getting some data that is not just less bad…but actually looks pretty darn good. So I want to highlight that today in order to show the still ugly underbelly of this information so we don’t get sucked into the falsely positive view.
The best place to see what I am talking about is yesterday’s release of the ISM Services report that blew away estimates at 57.1. On top of that good news was that the forward looking New Orders component came in at an even higher 61.6.
HOLY SMOKES THAT IS AWESOME!
But wait. Why are these readings so high when it is a bit hard to believe versus our gut sense of the current state of the economy?
Well we have to dig into the actual construction of this report (and its sister report, ISM Manufacturing). And there we find that all they do is ask questions with the same basic theme. And that is…Is business looking better than before?
Not how much better. Not about year over year growth. Simply they are asking if business right now is looking better than beforehand.
Hopefully you already see the problem. Which is that business across the globe were DOA before now. So every little ounce of re-opening the economy looks better than before which creates a very false sense of expansion in the way this economic report is put together.
So here is when this report gets a big dousing of cold water. And that is with the Employment component still anemic at 43.1.
Meaning that if business was looking so splendiferous than the companies would want to expand and hire back MANY more people. Because normally the Employment reading is in line with the rest of the report.
Yet here you see that business are really saying…oh yeah, business is better than the non-existent business we had in March through May. But it is still PAINFULLY bad and thus have no desire to hire more people at this time.
A similar complaint could be made with the recent signs of job gains in monthly employment reports (ADP & Government). Yes, some of the furloughed people are being brought back to their jobs which shows up as gains.
The better way to read this is from the Continuing Claims report every Thursday which comes hand in hand with the new claims. So we all know that the new claims is still shockingly high at like 1.4 million a week. That is 2X worse than the most painful week during the great recession.
On top of that we are still at over 19 million continuing claims which is 3X worse than the peak of the Great Recession. And that is where we stand today as many of the furloughed people come back to work.
So now imagine what happens 3-6 months from now as these businesses realize there is not really enough business to support the size of their staff leading to a new and more lasting round of job loss. That is where the supposed “V” of this recovery actually becomes a “W” as we sink back lower again on the economic front…and logically that should extend to a lowering of stock prices.
Here is a cleaner read on the poor state of the economy. That is the little followed, but still vital Redbook weekly retail sales report. This morning it came in at -6.9% year over year. It is that 12 month view of things that gives the better perspective of how much lower sales are than the past putting the true weakness of the economy on display.
Now let’s me show you how these results compare to the Great Recession period from 2008-2009 when the stock market fell about 60% from peak to valley.
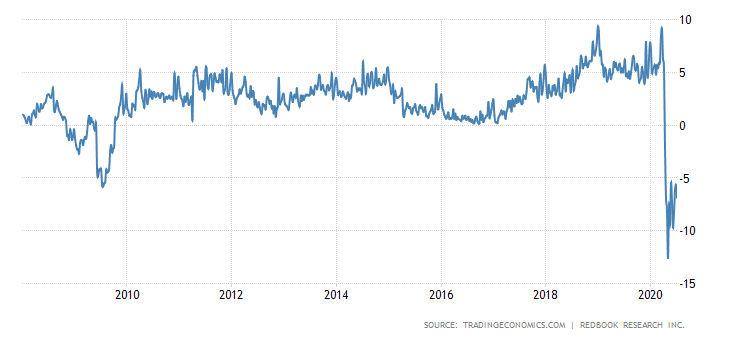
As they say a picture is worth a thousand words. So you can see how much worse these results are than even the darkest hour of the Great Recession. And yet here we are closer to the all-time highs for stock prices than the bottom found in March. Something is amiss!
Adding it altogether you understand why I am not impressed by the recent economic data and not going to get dragged into a false bull rally. Because when the clarity of this W formation starts becoming clearer to others and we start sliding down the right side of that letter economically…stock prices should follow suit.
And if stock prices don’t fall then it is likely the sign of a stock bubble which we discussed in the Members Only Webinar yesterday….and how we would play that scenario. That shows up about 17 minutes into this video. But I suspect this bubble is unlikely which is why stocks keep struggling to break above 3,200. Like the Risk Off session today.
The much more likely outcome is that indeed, history does repeat itself. And that a recessionary economic event produces lower earnings and lower stock prices. I still very much believe that outcome is more a matter of “when” than “if”…which explains that current construction of our portfolio. More on that below…
Portfolio Update
Our hedged portfolio is working overtime to supply a +2.05% this week even as the S&P rises +1.45%. Meaning I built this hedge to rise as the market falls…so a nice bonus to see how well it is doing even of late as the market rises.
Pulling back the curtain to the past 3 weeks we see that the S&P is just a notch better than breakeven in that stretch at +0.66%. Gladly our hedge has that beat by a wide margin at +5.10%.
What to Do Next?
I know its crazy out there. And I am trying my best to help investors make sense and profit from the situation. The best way for me to do that is give you 30 days access to the Reitmeister Total Return.
This is my newsletter service where I share more frequent commentaries on the market outlook, trading strategy, and yes, a portfolio of hand selected stocks and ETFs to produce profits whether we have a bull…a bear…or anywhere in between.
And right now I continue to strongly believe bear makes a lot more sense than bull.
Just click the link below to see 4 stocks and 5 ETFs in the hedged portfolio now that should rise as the market sinks back into bear territory. And has risen +5.1% the last three weeks which is greater than 7X better than the S&P.
About Reitmeister Total Return newsletter & 30 Day Trial
Wishing you a world of investment success!

Steve Reitmeister
…but everyone calls me Reity (pronounced “Righty”)
CEO, Stock News Network and Editor, Reitmeister Total Return
SPY shares . Year-to-date, SPY has declined -0.56%, versus a % rise in the benchmark S&P 500 index during the same period.
About the Author: Steve Reitmeister

Steve is better known to the StockNews audience as “Reity”. Not only is he the CEO of the firm, but he also shares his 40 years of investment experience in the Reitmeister Total Return portfolio. Learn more about Reity’s background, along with links to his most recent articles and stock picks. More...
More Resources for the Stocks in this Article
| Ticker | POWR Rating | Industry Rank | Rank in Industry |
| SPY | Get Rating | Get Rating | Get Rating |
| .INX | Get Rating | Get Rating | Get Rating |
| DIA | Get Rating | Get Rating | Get Rating |
| IWM | Get Rating | Get Rating | Get Rating |
| QQQ | Get Rating | Get Rating | Get Rating |


