(Please enjoy this updated version of my weekly commentary from the POWR Growth newsletter).
First, let’s take a quick look at the 3-week, hourly chart of the S&P 500 and Russell 2000:
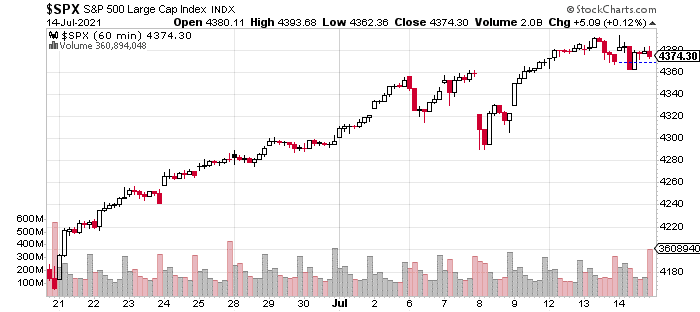
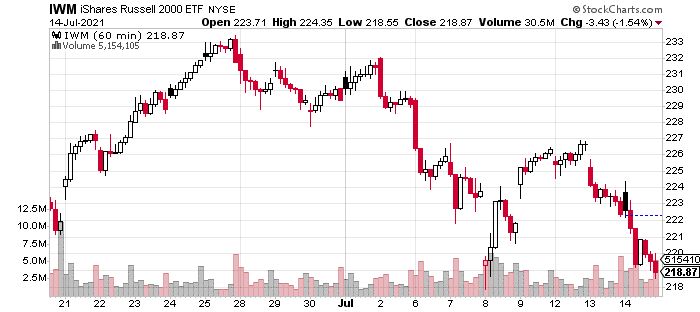
Last week we discussed the bifurcated market. As these charts make clear, the bifurcated market got even more bifurcated.
The Russell 2000 is near a 1-month low, while the S&P 500 is less than 1% from its all-time highs.
For growth investing, especially in small and mid-cap names, these are less than ideal conditions. In fact, they are sometimes more challenging than bear markets or corrections, because strength in the overall market lulls traders and investors into a sense of complacency.
Fortunately, we identified the market’s mirage and thus have managed to stay in the green. Further, we are in a prime opportunity to take advantage of the market’s next BIG move whether it’s a correction or a resumption of the uptrend.
Odds of a Correction?
However, despite the strength in the S&P 500 over the past week, I believe that we are seeing more signs of decay under the surface.
It’s not enough to pound the table or call for a correction but simply to note that the window for a correction is open.
Think about it this way – if it is rainy and foggy, then the chances of a car accident are higher. Doesn’t mean it’ll happen just means that we should drive a little slower, give more space to the car ahead of us, brake a little earlier, signal for a turn a bit sooner, etc.
Here’s a quick roundup of reasons why I’m feeling this way:
Fed’s Hawkish Pivot
In the last FOMC meeting and its minutes, the Fed’s focus is more on inflation and tapering asset purchases rather than the continued gap in employment. It’s not an outright change instance, it’s simply an acknowledgment that we are no longer in an economic emergency.
I don’t believe this is necessarily bearish, but I do think it changes one thing about the market.
Until now, bad economic news has been met with strength as it resulted in easier Fed policy and increased the odds and size of fiscal stimulus. Good economic news was good because it implies more earnings growth, and we were far from the threshold that it would result in Fed tightening.
I think the market’s Goldilocks period is over. This means that good economic news which could be construed as accelerating the Fed’s timeline could result in selling whereas this wasn’t the case a month ago.
Breadth Deteriorating
Market breadth gives us another perspective on the market’s strength that occasionally diverges from what the market averages are telling us.
These stats tell us what is going on in the “market of stocks” as opposed to the stock market.
There is a tendency for breadth to diverge with price at important turning points. We see this happening now:
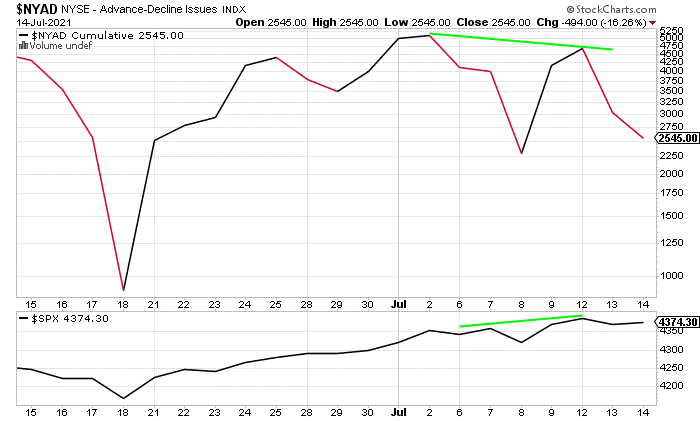
We can see the market making a higher high on July 12 but a higher low in terms of the NYAD cumulative line. During the last two pullbacks, we also saw a similar development:
February 2021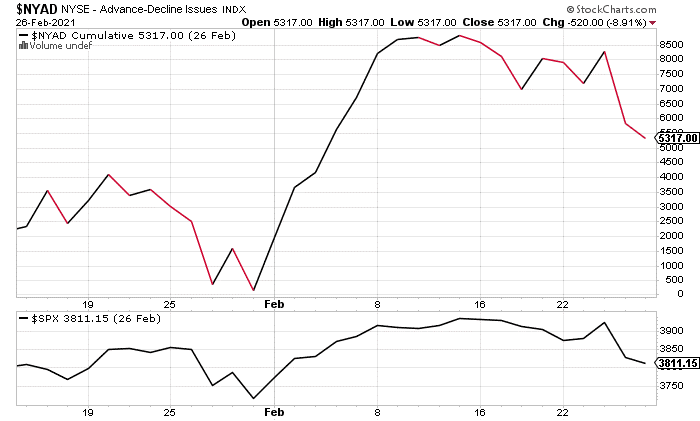
September 2020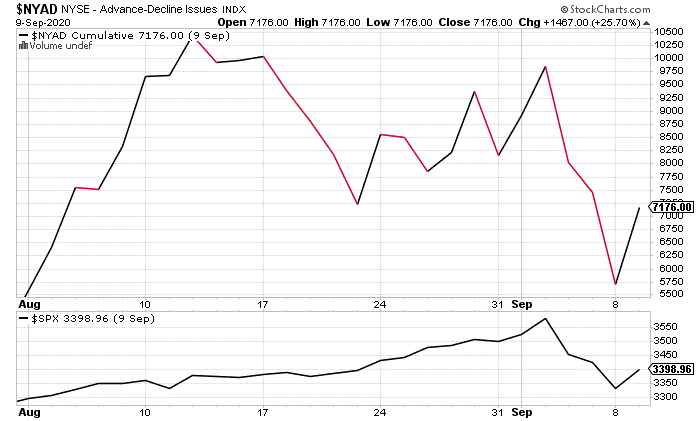
Again, this doesn’t mean we should turn bearish, it simply means that the chances of a significant selling event are higher than normal.
My interpretation is that market breadth gives us an idea of the market’s liquidity. When liquidity is strong in a bull market, the vast majority of stocks are advancing. When liquidity is weak, fewer stocks are participating which makes the market more vulnerable to a pullback.
Summary
For the last few months, little has changed in terms of overall market conditions. A handful of mega-cap and large-cap stocks are supporting the market’s strength, while the rest of the market is caught in a vicious rotation.
A lot of energy is being expended with little movement in price.
For our purposes, we remain in a position to jump on whatever trend emerges. A correction would provide an opportunity to add high-quality stocks at a discount. A resumption of the uptrend would allow us to jump into the strongest stocks showing signs of accumulation and earnings momentum. Continuation of the status quo would be an opportunity to exercise and strengthen our patience and discipline muscles.
Given the lack of trend in the growth stock universe, I’m focused on protecting profits and minimizing risk.
What To Do Next?
The POWR Growth portfolio was launched in early April and is off to a fantastic start.
What is the secret to success?
The portfolio gets most of its fresh picks from the Top 10 Growth Stocks strategy which has stellar +46.42% annual returns.
If you would like to see the current portfolio of growth stocks, and be alerted to our next timely trades, then consider starting a 30 day trial by clicking the link below.
About POWR Growth newsletter & 30 Day Trial
All the Best!
Jaimini Desai
Chief Growth Strategist, StockNews
Editor, POWR Growth Newsletter
Want More Great Investing Ideas?
SPY shares were trading at $434.77 per share on Thursday afternoon, down $1.47 (-0.34%). Year-to-date, SPY has gained 17.05%, versus a % rise in the benchmark S&P 500 index during the same period.
About the Author: Jaimini Desai

Jaimini Desai has been a financial writer and reporter for nearly a decade. His goal is to help readers identify risks and opportunities in the markets. He is the Chief Growth Strategist for StockNews.com and the editor of the POWR Growth and POWR Stocks Under $10 newsletters. Learn more about Jaimini’s background, along with links to his most recent articles. More...
More Resources for the Stocks in this Article
| Ticker | POWR Rating | Industry Rank | Rank in Industry |
| SPY | Get Rating | Get Rating | Get Rating |
| .INX | Get Rating | Get Rating | Get Rating |
| DIA | Get Rating | Get Rating | Get Rating |
| IWM | Get Rating | Get Rating | Get Rating |
| QQQ | Get Rating | Get Rating | Get Rating |


