

(Please enjoy this updated version of my weekly commentary from the POWR Growth newsletter).
As usual, we will start by reviewing the past week…
Here is an hourly, 3-week chart of the S&P 500:
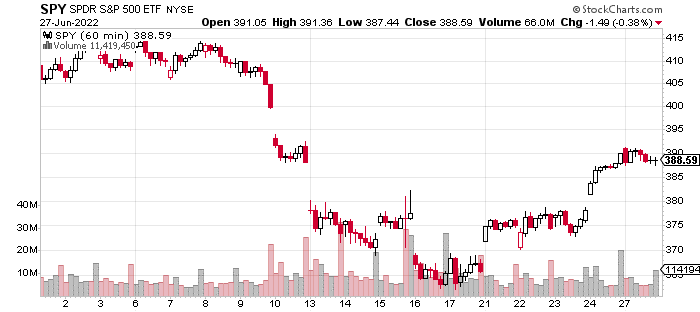
From last Friday’s close, the S&P 500 (SPY - Get Rating) is up 5.4%. The ascent has been pretty smooth and steady with broad participation.
The one interesting development is that bonds are catching a bid which makes sense with a sharp slowdown in many parts of the economy, and energy prices finally falling over the past week. And, this is leading to outperformance in some growth stocks.
For most of this year, we’ve had the dynamic of EPS growth offset by higher rates which led to falling multiples. Now, rates could be capped and start declining along with growth and inflation which implies falling EPS but provides a lift to multiples.
What would outperform in this circumstance?
I believe we would see strength in QUALITY GROWTH. And, we have been increasing our exposure to this group.
Let’s turn to the economy…
As we covered in the Intro, I see it as more of a ‘bounce’ rather than a multiweek rally that would retrace a big chunk of the 20%+ drop in the indices.
The bounce is due to commodity prices pulling back which has been the major inflationary component that hasn’t weakened in recent months. If this trend continues, then it could signal that we have peaked in terms of the inflation threat – certainly a bullish impulse for markets.
But, I think the market is being myopic in not realizing that the reason for this ebbing of inflationary pressures is due to the economy slowing.
Copper-Gold Ratio
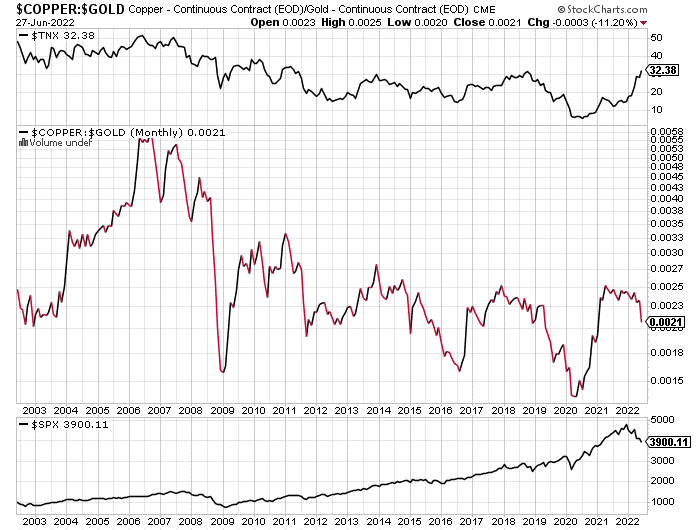
I think we can see the market’s myopia most clearly in the chart above. The copper to gold ratio moves higher when the market (SPY - Get Rating) is optimistic about growth and lower when it’s pessimistic. So, it makes sense that the 10Y yield also follows this path.
Incidences when Treasuries were moving higher but the ratio is moving lower are historically rare. The last one was in 2018 when stocks collapsed late in the year until Chair Powell announced his monetary pivot. And, this was a similar dynamic of the Fed tightening into a slowing economy.
This disconnect between the Fed and the economy is one reason for my belief that we could see another leg lower.
Bull vs Bear
So far, market weakness in 2022 has been due to multiple compression as earnings have continued to grow (and are forecast to grow another 3% in Q2).
If we do see earnings deteriorate, then that would be the catalyst for the next leg down as I don’t think multiple compression will be a meaningful bearish force unless inflation re-ignites.
On the other hand, the ‘goldilocks’ bullish case is that oil prices and other inflationary pressures moderate, while the economy slows and avoids recession. This could be the ‘soft landing’ scenario. In my opinion, this is possible but not probable.
Instead, I’m expecting weakness in earnings and a continued deterioration in growth prospects which will cause weakness in certain pockets of the market while leading to outperformance in QUALITY GROWTH.
This is the primary focus at the moment. Using weakness in the S&P 500 (SPY - Get Rating) to increase exposure to this category.
What To Do Next?
The POWR Growth portfolio was launched in April last year and since then has greatly outperformed just about every comparable index…including the S&P 500, Russell 2000 and Cathie Wood’s Ark Innovation ETF.
What is the secret to success?
The portfolio gets most of its fresh picks from the Top 10 Growth Stocks strategy which has stellar +49.10% annual returns. I then take the very best stocks from this strategy and tell you exactly what to buy & when to sell, so you can maximize your gains.
If you would like to see the current portfolio of growth stocks, and be alerted to our next timely trades, then consider starting a 30 day trial by clicking the link below.
About POWR Growth newsletter & 30 Day Trial
All the Best!
Jaimini Desai
Chief Growth Strategist, StockNews
Editor, POWR Growth Newsletter
Want More Great Investing Ideas?
SPY shares were trading at $382.86 per share on Tuesday afternoon, down $5.73 (-1.47%). Year-to-date, SPY has declined -18.79%, versus a % rise in the benchmark S&P 500 index during the same period.
About the Author: Jaimini Desai

Jaimini Desai has been a financial writer and reporter for nearly a decade. His goal is to help readers identify risks and opportunities in the markets. He is the Chief Growth Strategist for StockNews.com and the editor of the POWR Growth and POWR Stocks Under $10 newsletters. Learn more about Jaimini’s background, along with links to his most recent articles. More...
More Resources for the Stocks in this Article
| Ticker | POWR Rating | Industry Rank | Rank in Industry |
| SPY | Get Rating | Get Rating | Get Rating |
| .INX | Get Rating | Get Rating | Get Rating |
| DIA | Get Rating | Get Rating | Get Rating |
| IWM | Get Rating | Get Rating | Get Rating |
| QQQ | Get Rating | Get Rating | Get Rating |


