
(Please enjoy this updated version of my weekly commentary published January 3rd, 2023 from the POWR Growth newsletter).
At the beginning of last week’s commentary, Reity wrote, “the typical bullish bias of the holidays is not at hand this year…”
That has continued to be the case over the past few days. And that — along with two other technical signals I’ll show you today — is why traders need to be cautious as we step into the new year.
WARNING: YOU’RE NOW APPROACHING A TECHNICAL ANALYSIS ZONE
I know, I know. Technical analysis? Really?
And the answer is yes! Really!
I know many among us believe reading charts is as scientific as reading tea leaves, but everything I’m about to show you is based in logic. We’re not drawing cups and saucers or vomiting camels (my personal favorite chart pattern).
Let’s start by looking at this weekly chart for the S&P 500 (SPY). When you’re looking at technical patterns, longer periods (weeks vs. days) are always more significant. Any technical indicator — a signal, trend, pattern, etc. — must be stronger for it to show up on a weekly chart.
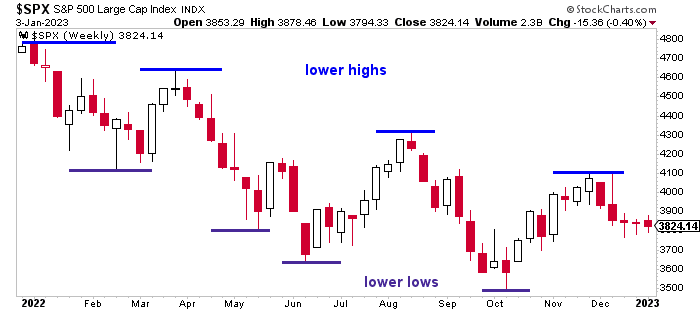
This weekly chart is bearish. The most basic definition of a downtrend is a series of lower highs and lower lows. And that’s generally what we’ve seen in 2022. While rallies in the summer and fall generated excitement, they failed to break the downtrend.
And that’s not surprising when you think about it. The market was full of negative news in 2022. Supply chain issues. Inflation we just couldn’t shake. Rising interest rates. The most hawkish Fed we’ve seen in decades.
Just think back to how many times Reity was pulling his hair out over all the “fool’s rallies” we saw this year. No one actually thought those rallies would last. They were driven solely by irrational exuberance, not positive fundamentals. That’s why the market stayed in its downtrend.
(See? Logic!)
That’s the first technical signal that’s urging caution — an ongoing downtrend in the broader market.
Next up is one of my very favorite technical indicators… the VIX and its moving average.
For those less familiar, the VIX is often referred to as the “fear” index because “it moves higher when fear rises.” But that’s really a simplification for what we’re looking at.
What VIX measures is volatility, and specifically volatility for the S&P 500. Without getting into all the math, VIX is calculated from options prices on S&P 500 futures.
When the market falls sharply, institutional traders buy puts on futures to hedge. (It’s the most efficient way for them to do so.) Their buying drives up the price of the options because higher demand means higher prices, just like higher demand for a stock drives up its price). The higher prices are fed into the VIX formula, and VIX rises.
So, a high or rising VIX means the “smart” money — those big, institutional financial behemoths — think the market’s going to fall in the next 30 days. That’s a pretty bearish sign.
Which brings me to our next chart.
Below, you’ll see the same weekly chart of the S&P 500 (SPY), but this time with a box underneath it. In that box is the VIX (black line), as well as the 10-week moving average — or approximately the very popular 50-day moving average — for the VIX (navy line).
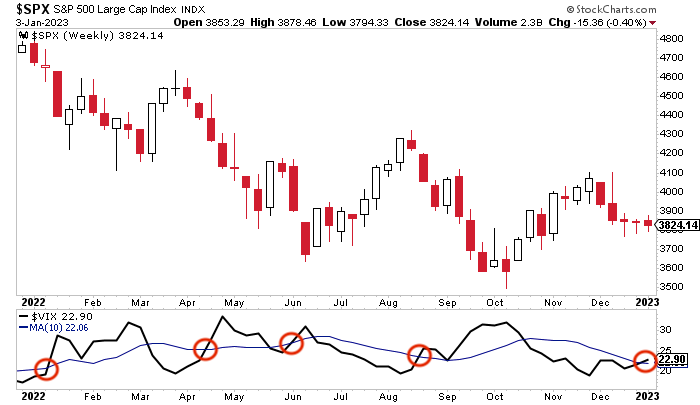
When VIX (black line) crosses above its moving average (navy line), it tells us that volatility is rising (bearish)… and more so than usual (even more bearish).
Last week, VIX crossed above its moving average. That doesn’t mean we’re guaranteed a major selloff, but it does tell us that the big institutions are taking a bigger and bigger hedge position for the next 30 days.
It’s not magic. It’s also not particularly optimistic. And it’s definitely worth paying attention to.
Finally, we come to our third call for caution. That lack of holiday bullishness…
“If Santa Claus fails to call, bears may come to Broad and Wall.”
That’s an old-timer trader’s reference to the Santa Claus rally, which I wrote about last week, and the location of the New York Stock Exchange (at the corner of Broad Street and Wall Street).
This old saying is easily tested. If the S&P 500 fails to deliver a gain over the last five trading days of the year and the first two trading days of the new year, we should have a chance to buy stocks at significantly lower prices later in the year.
In the past 50 years, there have been just 12 times the S&P showed a loss over this time. The next year closed down four times. A double-digit decline occurred five times.
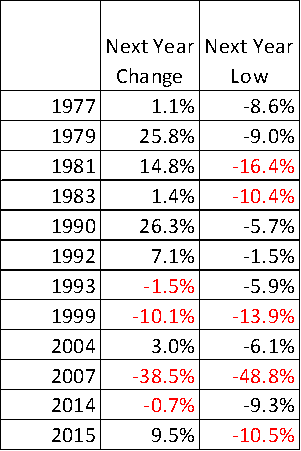
It might seem like there’s not much to this idea. But there is a slight bias toward bearishness in the years that follow Christmas declines.
Overall, there is a 33% chance of a decline the next year as opposed to a 24% chance after a rally. The chance of a double-digit decline is 42%, significantly greater than the 24% chance of a decline of that size in years with rallies.
Can the performance of seven specific trading days really determine whether the stock market will have an up or down year?
Of course not. But, just like the two other technical indicators I showed you, it can be an important reflection of how investors (both big and small) are feeling at the start of the year.
From what we’ve seen…
There’s not enough positive fundamental evidence to break the ongoing downtrend… Major institutions are taking out bigger and bigger hedges for the next 30 days… And while it’s not the “nail in the coffin” for 2023, I do think a failed Santa Claus rally would kick the year off to a bearish start.
We’ll know for certain tomorrow; if the S&P 500 closes below 3,822.39, we’ll know “2022” was on Santa’s naughty list.
All of this seems like good reason to tread cautiously these next few weeks.
What To Do Next?
See my top stocks for today’s market inside the POWR Growth portfolio.
This exclusive portfolio gets most of its fresh picks from our proven “Top 10 Growth Stocks” strategy which has produced stellar average annual returns of +49.10%.
And yes, it continues to outperform by a wide margin even during this rough and tumble bear market cycle.
If you would like to see the current portfolio of growth stocks, and be alerted to our next timely trades, then consider starting a 30 day trial by clicking the link below.
About POWR Growth newsletter & 30 Day Trial
All the Best!
Meredith Margrave
Chief Growth Strategist, StockNews
Editor, POWR Growth Newsletter
Want More Great Investing Ideas?
SPY shares fell $0.26 (-0.07%) in after-hours trading Wednesday. Year-to-date, SPY has gained 0.35%, versus a % rise in the benchmark S&P 500 index during the same period.
About the Author: Meredith Margrave

Meredith Margrave has been a noted financial expert and market commentator for the past two decades. She is currently the Editor of the POWR Growth and POWR Stocks Under $10 newsletters. Learn more about Meredith's background, along with links to her most recent articles. More...
More Resources for the Stocks in this Article
| Ticker | POWR Rating | Industry Rank | Rank in Industry |
| SPY | Get Rating | Get Rating | Get Rating |
| .INX | Get Rating | Get Rating | Get Rating |
| DIA | Get Rating | Get Rating | Get Rating |
| IWM | Get Rating | Get Rating | Get Rating |
| QQQ | Get Rating | Get Rating | Get Rating |