

(Please enjoy this updated version of my weekly commentary published December 13th, 2021 from the POWR Growth newsletter).
First, let’s do our regular review of the past week:
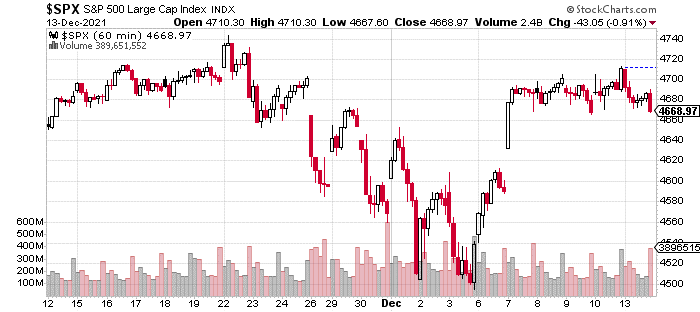
So, the S&P 500 exemplifies what I was discussing in the introduction.
With the S&P 500, we have a nice bounce and ascent from last week’s retest of last Friday’s lows. However, it’s a much diffeent situation if we look at the Russell 2000 whose chart we see below:
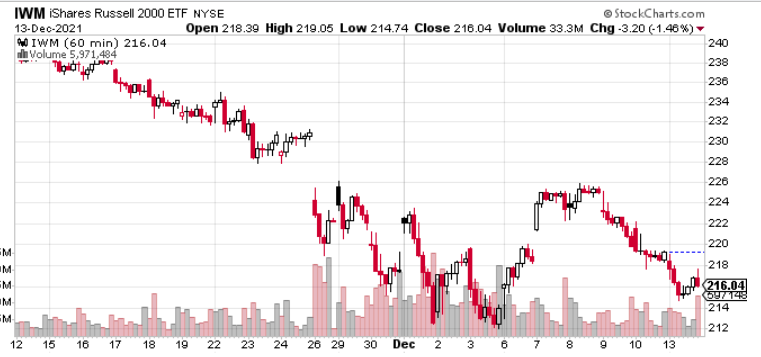
The small-cap index is in a much different place than the S&P 500 having given back the bulk of its gains. And, the story gets even worse if we look at growth stocks which are making new lows in many cases.
Why are growth/small-caps so weak and mega-caps so strong?
Both of my predictions came true as small-caps are retesting lows, while the large-cap and mega-caps are exhibiting remarkable relative strength.
I think this market bifurcation and volatility is likely to continue until the FOMC meeting on Wednesday where we should get some clarity on the taper and rate hike timetable. According to Fed Fund futures, odds went from expectations of between 0 to 1 hikes in 2022 to between 3 and 4 over the past couple of months.
The Bullish Case for Stocks
This is a headwind for stock prices, although it has been somewhat offset by the decline in longer-term rates which has accompanied the firming of short-term rates.
(From early October to now, the yield on the 2-year went from .3 to .65, basically pricing in 1.5 more rate hikes. But, the yield on the 30-year dropped from 2.15% to 1.85%.
However, this is mostly a positive for mega-cap stocks as their large balance sheets mean they are able to take advantage of the drop in long-term rates by issuing long-term bonds.
Another factor offsetting this has been the beginnings of what seems like another strong earnings season. Remember that strong earnings is one of the factors that triggered the big breakout in October.
As long as earnings keep expanding, we should continue to buy dips in the market. Despite the economy’s challenges, earnings and margins continue trending in the right direction. I see another strong earnings season that will defy skeptics and lift stocks to new highs.
But what should not be discounted is that the market has worked off excesses and overbought conditions through rotations.
And, some of these rotations have been brutal – as we are experiencing now.
However, we’ve sidestepped the bulk of these losses and managed to hold onto the bulk of our gains by increasing allocation to sectors that have outperformed like semiconductors, housing, and industrial metals. Still, even these parts of the market experience drawdowns when the market is in a risk-off mood.
However, I’m confident that these circumstances are quite extreme and won’t persist.
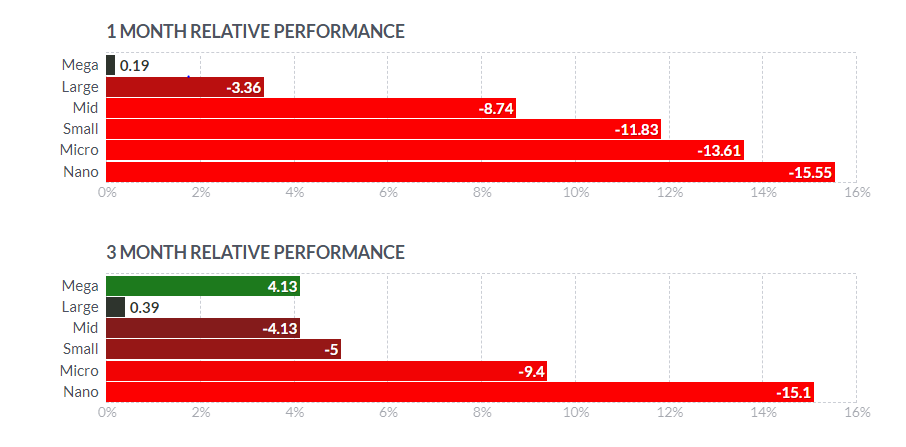
The two charts above also show the extreme bifurcated nature of the market with megacaps flat, while small caps are down more than 10%.
This ratio has gotten way too skewed, and we will see it revert to normal especially as an environment with such strong earnings growth favors small-cap and growth stocks.
What To Do Next?
The POWR Growth portfolio was launched in early April and is off to a fantastic start.
What is the secret to success?
The portfolio gets most of its fresh picks from the Top 10 Growth Stocks strategy which has stellar +46.42% annual returns.
If you would like to see the current portfolio of growth stocks, and be alerted to our next timely trades, then consider starting a 30 day trial by clicking the link below.
About POWR Growth newsletter & 30 Day Trial
All the Best!
Jaimini Desai
Chief Growth Strategist, StockNews
Editor, POWR Growth Newsletter
Want More Great Investing Ideas?
SPY shares were trading at $461.17 per share on Tuesday afternoon, down $5.40 (-1.16%). Year-to-date, SPY has gained 24.55%, versus a % rise in the benchmark S&P 500 index during the same period.
About the Author: Jaimini Desai

Jaimini Desai has been a financial writer and reporter for nearly a decade. His goal is to help readers identify risks and opportunities in the markets. He is the Chief Growth Strategist for StockNews.com and the editor of the POWR Growth and POWR Stocks Under $10 newsletters. Learn more about Jaimini’s background, along with links to his most recent articles. More...
More Resources for the Stocks in this Article
| Ticker | POWR Rating | Industry Rank | Rank in Industry |
| SPY | Get Rating | Get Rating | Get Rating |
| .INX | Get Rating | Get Rating | Get Rating |
| DIA | Get Rating | Get Rating | Get Rating |
| IWM | Get Rating | Get Rating | Get Rating |
| QQQ | Get Rating | Get Rating | Get Rating |


