

At the end of July, I discussed some reasons to expect the S&P 500 (SPY) was going to make new highs in August. This prediction has come to fruition as the SPDR S&P 500 ETF (SPY - Get Rating) has gained more than 6% and exceeded its previous high from late-February.

The rally has been relentless – out of 18 trading days, there have been only 4 down days. The main factors driving the market higher have been expectations of further Fed action, marginal improvements in economic data, better than expected earnings reports, and positive developments in terms of a coronavirus vaccine, treatments, and testings.
Despite this bullish momentum, there are some warning signs that investors should take seriously:
Market Breadth
During the market’s recent advance, market breadth has been abysmal. Breadth is a tool to understand the market’s behavior from a bottom-up perspective. It’s showing that money is flowing into fewer and fewer stocks. If and when selling pressure emerges, stocks will be vulnerable to a steep decline.

In terms of market breadth, the rally peaked in early-June when 98% of stocks in the S&P 500 were trading above their 50-day moving average. Today, that figure is 73%.
We had a similar situation at the beginning of the year. The S&P 500 made a new high in February, however, there was divergence as breadth made a lower high compared to January.
We are seeing a similar divergence now. Fewer stocks are participating in the uptrend. It’s being masked by the strength in the indices, but there’s distribution.
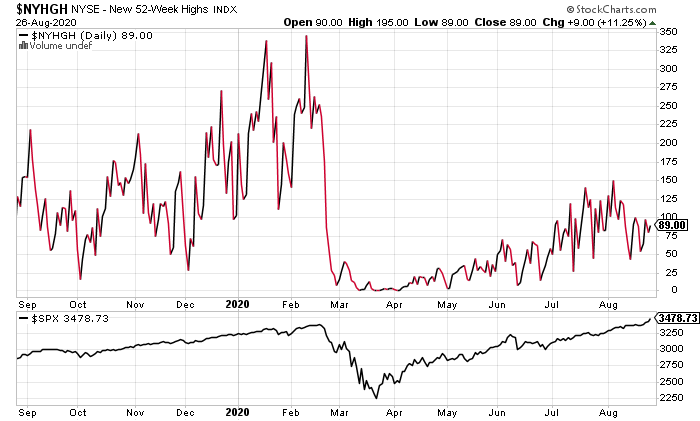
Another perspective is the new highs index. Ideally, as the stock market advances, the number of new highs expands which indicates the rally is broadening out.

However, on this break-out, this is not happening. Instead, the number of new highs is compressing. Additionally, despite the S&P 500 making new highs, the number of new highs on the New York Stock Exchange is nowhere near what we saw at the beginning of the year.
And, this same dynamic is present in the Nasdaq:
An analogy to help you think about breadth, and why it’s important: Think about a business with growing sales. Since sales are increasing, the operators assume that everything is fine.
However, if they take a closer look, they realize they are actually losing customers every month but a small number of customers are accounting for enough sales growth to offset these losses. At an aggregate level, it’s a positive situation, however, the business is becoming more vulnerable since its dependency on these customers is growing.
If they lose one of these customers, then the situation can turn bleak pretty quickly.
Another perspective is by the price action of small-cap stocks during this advance.

Small-caps are the most economically sensitive area of the market. They’ve been selling-off over the past couple of weeks, while the S&P 500 moves higher.
You can track small-cap stocks with the iShares Russell 2000 ETF (IWM - Get Rating).
Sentiment
Sentiment is reaching extreme, bullish levels. Basically, there aren’t many buyers left. This creates downside risk as once prices start falling, it can cascade and lead to steep declines.
We can see this below with the four-week average of the National Association of Active Investor Managers’ Survey which shows 100% long allocation. The best long-term opportunities in the market are correlated to periods with low levels of allocation to long positions.
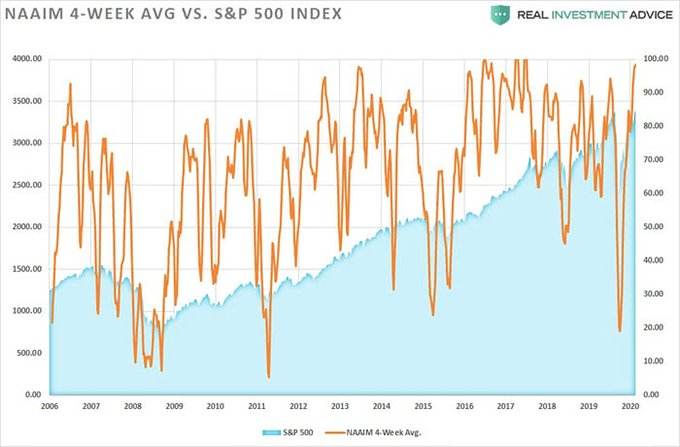
(source: NAAIM; Real Investment Advice)
Another indication that sentiment has reached extreme levels is by declining put volume. This is showing that investors are becoming complacent and no longer hedging their positions. This behavior also creates conditions when stocks are most vulnerable to a nasty tumble.

(Source: CBOE)
This is also evident from the 5-day moving average of the put/call indicator.

(Source: CNN)
Over the last 5 months, the market’s mood has changed from fear to greed. These climates are associated with poor, long-term returns and increased risk of violent pullbacks.
Historical Extremes
Another indication that the market’s recent price action has been unusual is that it’s hitting records in terms of how extended it’s gotten compared to its 200-day moving average. This is another warning sign as history shows this is a mean-reverting indicator.
This extreme reading can resolve in two ways – either the S&P 500 will decline or trade in a range for an extended period and let the 200-day moving average catch up.

Warren Buffett’s favorite tool to evaluate whether stocks are overvalued is by comparing the total market cap of the Wilshire 5000 to GDP. This is also hitting levels that have never been seen before.
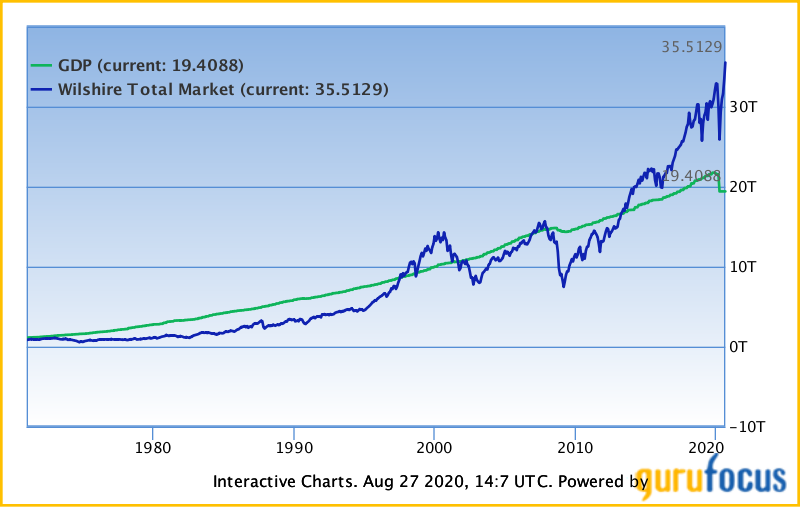
This is not useful for timing, but it can help us gain greater insight into reasonable expectations for returns, measure risk, and figure out where we are in the market cycle.
Closing Thoughts
It’s clear that there’s more risk at current levels. But now, the short-term risks are aligned with longer-term risks.
It’s my opinion that investors should think about taking some profits and preparing for the market’s next buying opportunity where risks and rewards are more balanced.
Want More Great Investing Ideas?
7 Best ETFs for the NEXT Bull Market
Why Stocks Could Drop 20% in September?
9 “BUY THE DIP” Growth Stocks for 2020
SPY shares were trading at $348.07 per share on Thursday afternoon, up $0.50 (+0.14%). Year-to-date, SPY has gained 9.26%, versus a % rise in the benchmark S&P 500 index during the same period.
About the Author: Jaimini Desai

Jaimini Desai has been a financial writer and reporter for nearly a decade. His goal is to help readers identify risks and opportunities in the markets. He is the Chief Growth Strategist for StockNews.com and the editor of the POWR Growth and POWR Stocks Under $10 newsletters. Learn more about Jaimini’s background, along with links to his most recent articles. More...
More Resources for the Stocks in this Article
| Ticker | POWR Rating | Industry Rank | Rank in Industry |
| SPY | Get Rating | Get Rating | Get Rating |
| IWM | Get Rating | Get Rating | Get Rating |
| .INX | Get Rating | Get Rating | Get Rating |
| DIA | Get Rating | Get Rating | Get Rating |
| QQQ | Get Rating | Get Rating | Get Rating |


