
It seems we can’t go a day without the media hyping recession risk and highlighting some analysts predicting scary market slides ahead. Here’s one example from this weekend, courtesy of CNBC.
This S&P 500 chart just sent a screaming sell signal—here’s how to trade it
Most such calls are guesses based on some combination of technical indicators and plausible-sounding combinations of bad things happening with the economy, mostly due to the worsening trade war.
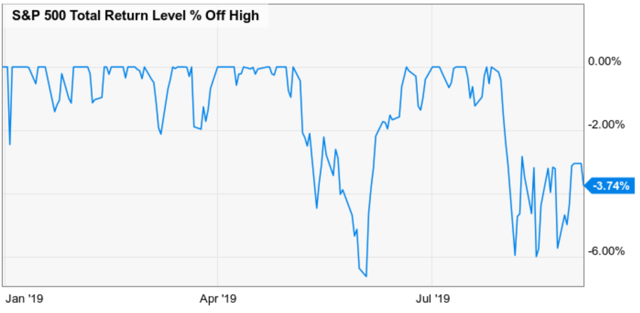
(Source: Ycharts)
As you can see, the S&P 500 has seen a lot of volatility over the past month, when President Trump announced the 4th (and later 5th) escalation in the trade war.
But ultimately, even factoring in the 1% slide (as I write this on September 3rd), stocks are down less than 4% from their recent all-time highs.
So rather than peddle hyperbole and fear, let’s look at the actual facts about the US economy, both good and bad, to see just how worried you should be about the current trade war-related pullback turning into a correction and then morphing into an ugly and painful bear market.
Despite What the Yield Curve Says, Recession Is Still the LESS Probable Outcome
Since the August 1st tariff threats were made bond yields have plunged with a vengeance.
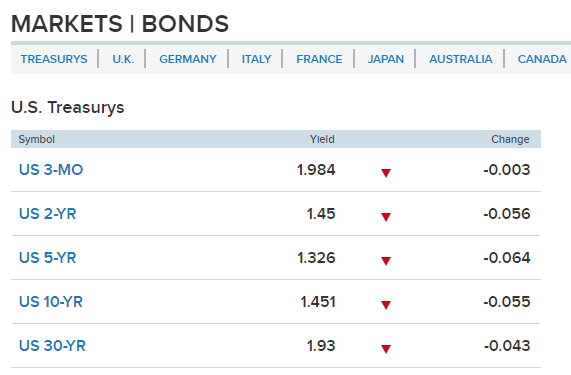
(Source: CNBC) – data as of 9:25 AM EST, September 3rd
A flight to safety in risk-free bonds (fundamental risk, not valuation risk) have caused $17 trillion or about 25% of global debt to now trade at negative yields. In the US every major yield curve except the 30y-2y one have inverted.
According to Ploutos research, long-duration US treasuries had their 4th largest single month rally in August…in 46 years (10.5%). For context, that’s more gains than the stock market has historically delivered over time, in an entire year.
The media is full of scary headlines about how the yield curve is now predicting a recession in 2020 or 2021 (average time from inversion to recession is 13 to 16 months, depending on which curve you look at).
However, here’s what the inverted yield curve actually means. Allow me to demonstrate with the historically most accurate one (10y-3m) and the economic growth/recession risk model from the Cleveland Fed and Haver Analytics.
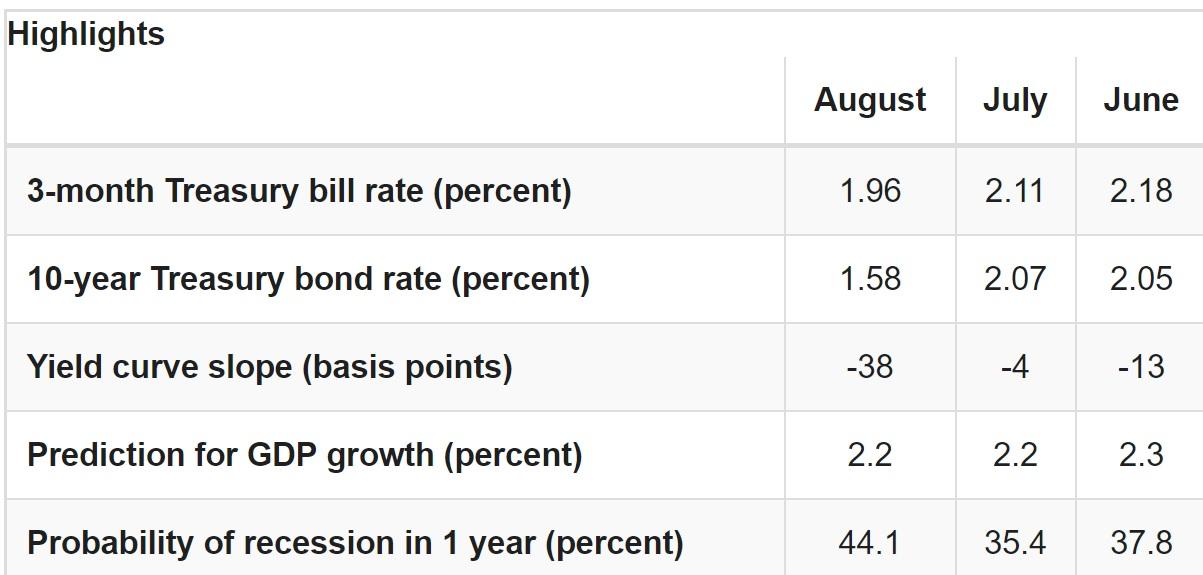
(Source: Cleveland Federal Reserve) – data as of August 26th
The Cleveland Fed’s model uses the average of the past month’s yield curve slope (normally positive) to estimate how fast the economy is growing now and the probability of a recession starting within a year.
Since the model only updates once per month, I’ve built a real-time recession risk model that uses the last three months worth of available Cleveland Fed data to estimate what the probability is at any given time assuming
- current economic conditions persist
- the current inversion persists for an entire month becoming the new monthly average
That model has been very accurate, in terms of lining up with models from BAC, JPM, the New York Fed and Jeff Miller (Seeking Alpha’s economic guru).
What does that model say about current recession risk given the current 53.3 basis point yield curve inversion? That if the current inversion were to last an entire month, the Cleveland Fed would next estimate (in late September) 12-month recession risk of 48%.
Another way to say that is “if current conditions persist, meaning no progress on the trade deal is achieved in 2020, the bond market believes there is a 52% probability we DON’T get a recession in 2020.”
We might get much slower growth next year, but investors care about recessions because since 1945 we have yet to have one without a bear market. In contrast, we’ve had just two non-recessionary bear markets during that time period.
Or to put another way, without recession any correction is likely to remain a correction, and not become one of the scary market crashes you see so many permabears predicting on TV.
But models by themselves, no matter how well designed, aren’t something to bet your life savings on. They can only tell you what’s likely to happen based on what’s occurred in the past when fundamentals were roughly similar.
When it comes to making real money decisions you need to corroborate models with actual economic data. So let’s take a look at that next, to see why there is little reason to fear a recession coming soon.
The US Economy Remains Strong And Unless That Changes, No Recession Is Possible And a Bear Market Is Unlikely
There are so many economic reports coming out each month that it can be easy to get worried when several point to negative growth. For example, per the Fed’s own data, US manufacturing is currently contracting about 2% per year, a mild recession.
But it’s important to keep in mind that the $21 trillion US economy is highly diversified and weak parts can be overcome by strength in other areas. Manufacturing/industrial accounts for 25% of GDP (down from 65% in 1950).
Consumer spending accounts for 70% of GDP growth and thus far a strong job market has resulted in wage growth of over 3% in 2019, which combined with 1.6% core inflation, means real wage growth remains at some of the highest levels in 10 years.
Which likely explains why the US economy is actually very strong right now, as shown in David Rice’s Baseline and Rate of Change or BaR economic grid.
This grid tracks 19 leading economic indicators that, together have predicted the last four recessions. What Mr. Rice does is tracks how far above historical baseline each indicator is and how fast it’s growing or contracting on a month over month basis.

(Source: David Rice)
The average of all the indicators, or mean of coordinates, thus represents an objective single number that summarizes the entire US economy reasonably well. Here you can see how the average of the indicators, on a quarterly basis, has tracked during this economic expansion.
At the lows of the Great Recession (-5.1% peak GDP decline, worst since WWII) the average of the indicators was nearly 50% below their historical baseline and contracting at about 17% month over month. In Q3 2018, the peak effect of tax reform and higher government spending, the MoC peaked at 32% above baseline and was expanding at about 7% month over month.
Before we look at what the economy looks like today, let’s consider the last two recessions, which were the mildest ever recorded (2001) and the worst since 1945 (Great Recession).
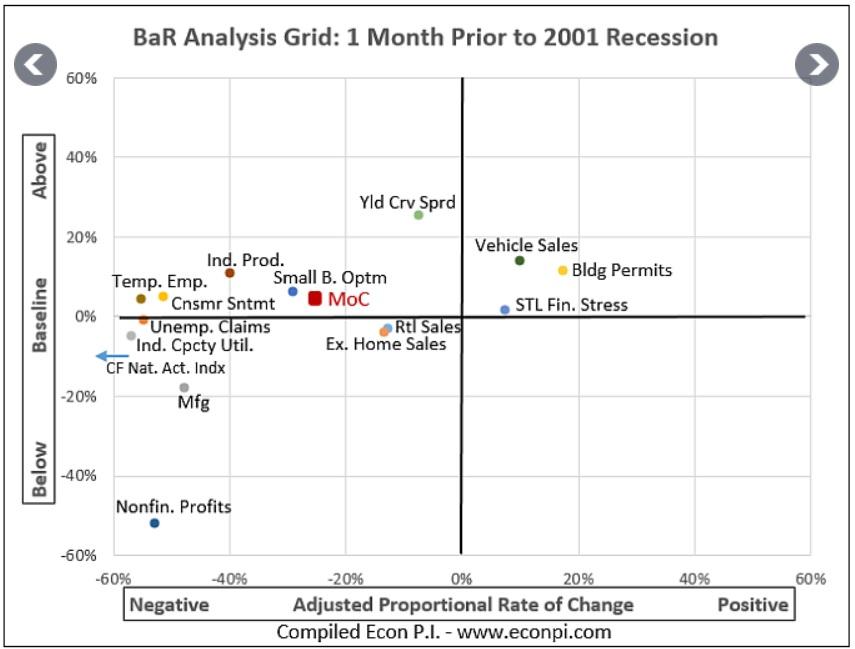
(Source: David Rice)
Before the mild 2001 recession, the average of the indicators was barely above baseline and contracting at about 23% month over month.
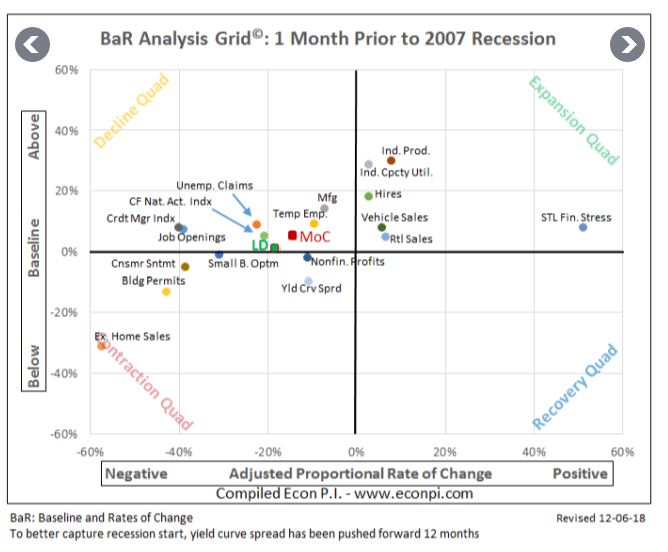
(Source: David Rice)
Before the Great Recession, the average of the indicators was also very low and the eight most sensitive ones (including the yield curve) were virtually at zero, and contracting at nearly 20% month over month.
Now let’s consider what our economy looks like today, 18 months into this trade war.
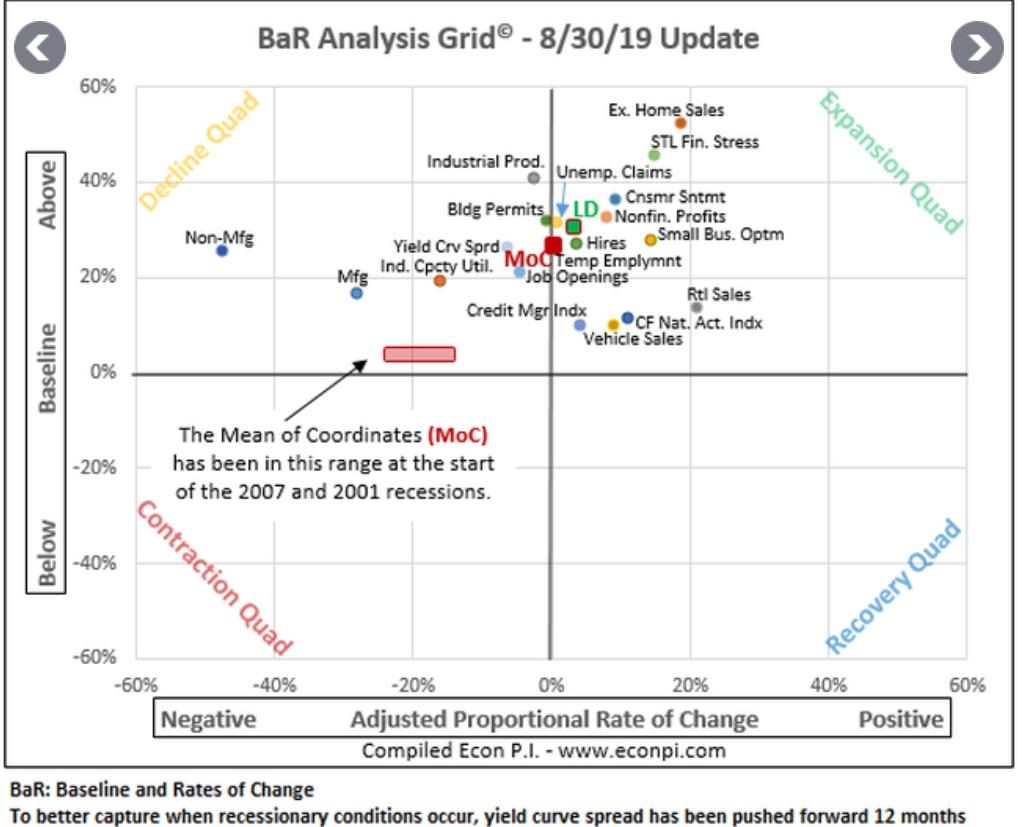
(Source: David Rice)
Not only is the average of all the indicators 27% above baseline, but it’s not contracting at all (neutral month over month growth). That’s an improvement over recent weeks when the MoC was contracting by as much as 10% month over month.
What’s more the eight most sensitive indicators (canaries in the coal mine for recession) are 31% above baseline and expanding about 4% month over month. In other words, the fastest-changing indicators are saying that things have been getting better, not worse, and if nothing changes, economic growth will likely stabilize or slightly accelerate off today’s 2.0% level.
How far the MoC is above baseline is what I use to determine how much of my monthly savings to put into stocks vs bonds, and what mix of defensive/cyclical companies to buy. Thus I track this data religiously.

(Source: David Rice)
The MoC is up 0.6% over the past two weeks (when trade war fears were running wild) and the average of the eight most sensitive indicators went up 0.3% over that time.
In other words, while the stock market is swinging wildly and the bond market is gripped by a safe haven buying frenzy, the actual economic data (the facts) say the US economy has been getting stronger.
Might that change in a hurry? Sure. But consider where we are now (27% above historical baseline) and how much warning we’d get before a recession actually started.
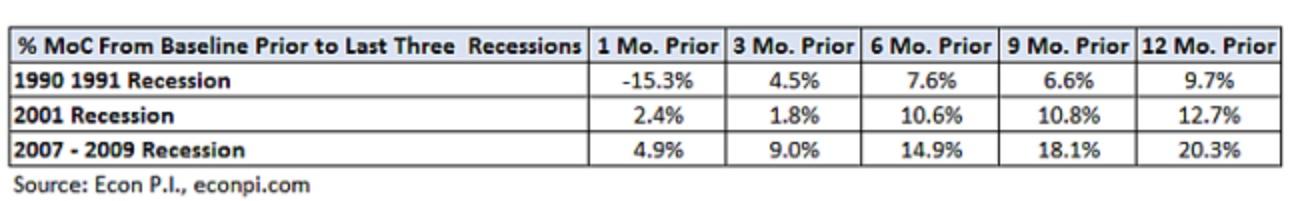
(Source: David Rice)
Here is how far above baseline the average of all the indicators was before the last three recessions. Mr. Rice has gone on record as saying that 20% above baseline is the danger zone to pay attention to. That could signal that a recession could be 12 months away IF negative fundamental deterioration were to continue AND if policy wasn’t adjusted, such as Trump ending the trade war or the Fed cutting rates aggressively.
This likely indicates that Mr. Rice’s July estimate of a recession being at least 18 months away (now 16 months) is reasonably accurate. That also lines up with the yield curve recession models.
But like I said, models can be wrong and as long as the economic fundamentals remain strong (20% or more above historical baseline) no recession is possible. And without recession a bear market becomes far less likely.
Bottom Line: The Cure For Fear Is Facts And Proper Portfolio Construction
In nearly six years as an analyst/investment writer, I’ve learned a lot. One of the most valuable truths I’ve come to realize is that the media loves to scare you because that’s what sells ads.
Yes, the yield curves are now inverted. Yes, the trade war is getting worse and US manufacturing is now contracting. Yes, consumer confidence is starting to turn lower due to escalating tariffs.
I’m not denying that the risks to our economy (and thus the stock market) are real. But risks are merely what MIGHT go wrong with the fundamentals. They are something to keep in mind, so you can build your portfolio into a bunker that includes
- adequate emergency funds (in case you lose your job during a recession)
- proper asset allocation (mix of cash/stocks/bonds, that limits volatility to the highest amount you can personally stand, emotionally or financially)
- good stock risk management (weighting by sector, industry and individual holding)
- above average quality companies (such as dividend growth stocks that will keep growing payouts during a recession)
If you have your financial house in order during the good times, then you have nothing to fear during the bad ones.
Could we get a recession in 2020? Sure. I watch the big macro data on a weekly basis and I’ll make sure to let you know long before any economic contraction begins.
But in the meantime don’t let the media scare you into potentially costly mistakes, like panic selling quality stocks, bought at good to great prices, ahead of a recession and bear market that remain the less probable events right now.
SPY shares were trading at $298.22 per share on Thursday morning, up $4.18 (+1.42%). Year-to-date, SPY has gained 20.43%, versus a % rise in the benchmark S&P 500 index during the same period.
About the Author: Adam Galas

Adam has spent years as a writer for The Motley Fool, Simply Safe Dividends, Seeking Alpha, and Dividend Sensei. His goal is to help people learn how to harness the power of dividend growth investing. Learn more about Adam’s background, along with links to his most recent articles. More...
More Resources for the Stocks in this Article
| Ticker | POWR Rating | Industry Rank | Rank in Industry |
| SPY | Get Rating | Get Rating | Get Rating |


