
Thanks to falling recession risk (24% vs 48% two months ago), stocks have staged an impressive five-week winning streak.
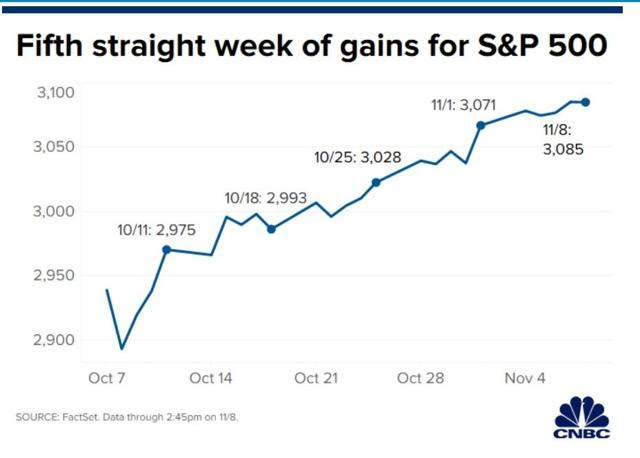
The S&P 500 has been on one heck of a run in 2019, sky-rocketing higher even faster than they did in 2017 during the tax cut euphoria rally when the market rose 14 consecutive months.
2019 Market Rally
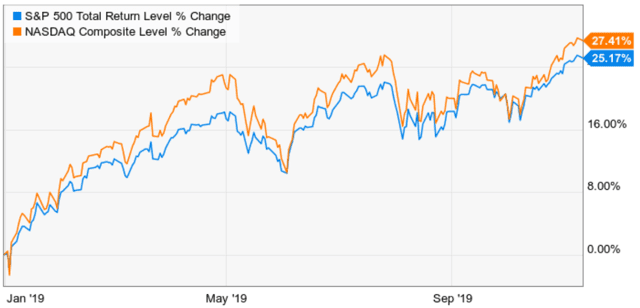
(Source: Ycharts)
2017 Tax Cut Rally
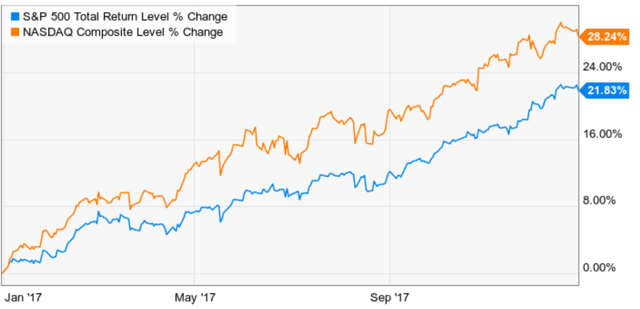
(Source: Ycharts)
Of course, there is a downside to such strong returns, which is that the risk of a short-term 5% to 9.9% pullback or 10% to 19.9% correction has gone up significantly.
So here are the most important things investors need to know about why the market’s five-week winning streak is likely to end soon, how to protect your portfolio, and how to best profit from any rise in short-term fear in the coming months.
Why Pullback/Correction Risk Is Now Elevated
While recession risk has been falling steadily for two months now, forward earnings growth expectations, both per FactSet and IBER, have also been coming down.
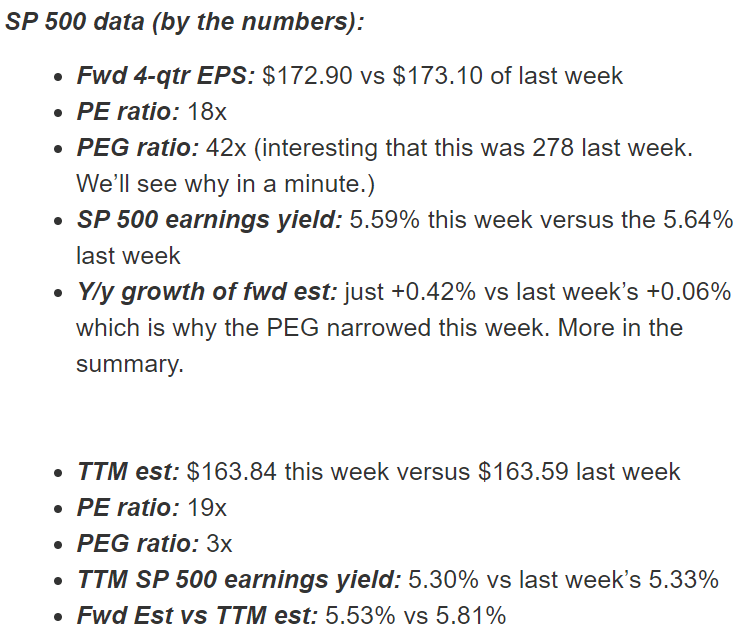
(Source: Brian Gilmartin)
Depending on which source you use, 2019 EPS growth is expected to be 0.1% to 0.4% this year. This means that pretty much all of the 2019 rally has come from multiple expansion.
Lower interest rates have stoked a bit of “there is no alternative” euphoria, and the result is that the S&P 500’s forward PE is up to 18.0. That’s about 10% above the 16.2 25-year average I use as a reasonable proxy for fair market value.
What’s more, the low volatility nature of this recent rally to all-time highs has also resulted in a bit of investor complacency.
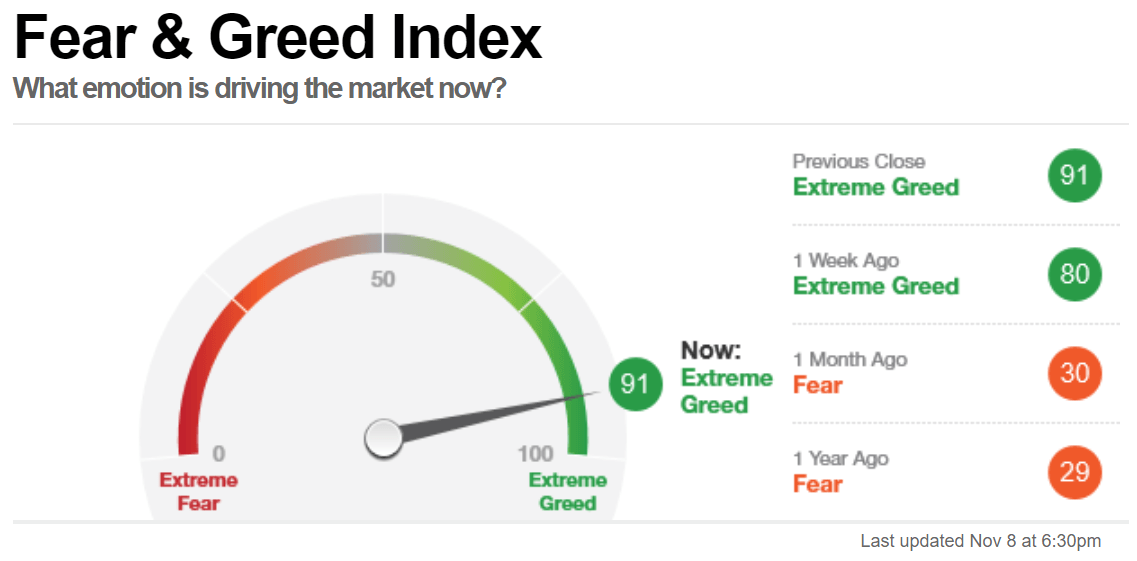
(Source: CNN)
That can be seen by the CNN Fear and Greed index which is composed of seven short-term technical indicators including
- the ratio of put to call option volumes
- the ratio of stocks hitting 52-week highs vs 52-week lows
- The McClellan Volume Summation Index (advancing volumes vs declining volumes)
- the difference in stock vs bond returns (safe-haven demand)
- market momentum (S&P 500 vs its 125-day moving average)
- the spread between junk bond yields and investment-grade corporate yields (risk asset demand)
- VIX (volatility index)
Now sentiment and valuation don’t tell us when a downturn will begin merely that one is likely. For example, back in late 2017, the Fear & Greed Index hit an even higher level than today (about 95) and yet the market didn’t experience a correction until January 26th, 2018. And that correction didn’t begin until the greed index was down to 80.
Broader market valuations and sentiment, when combined with historical analysis, can give us a rough estimate of when a pullback (5% to 9.9% decline) or correction (10% to 19.9%) is likely to occur.
Since 1945 we’ve averaged a pullback every six months, and a correction about every two years. That’s been the approximate frequency since the longest bull market in US history began as well.
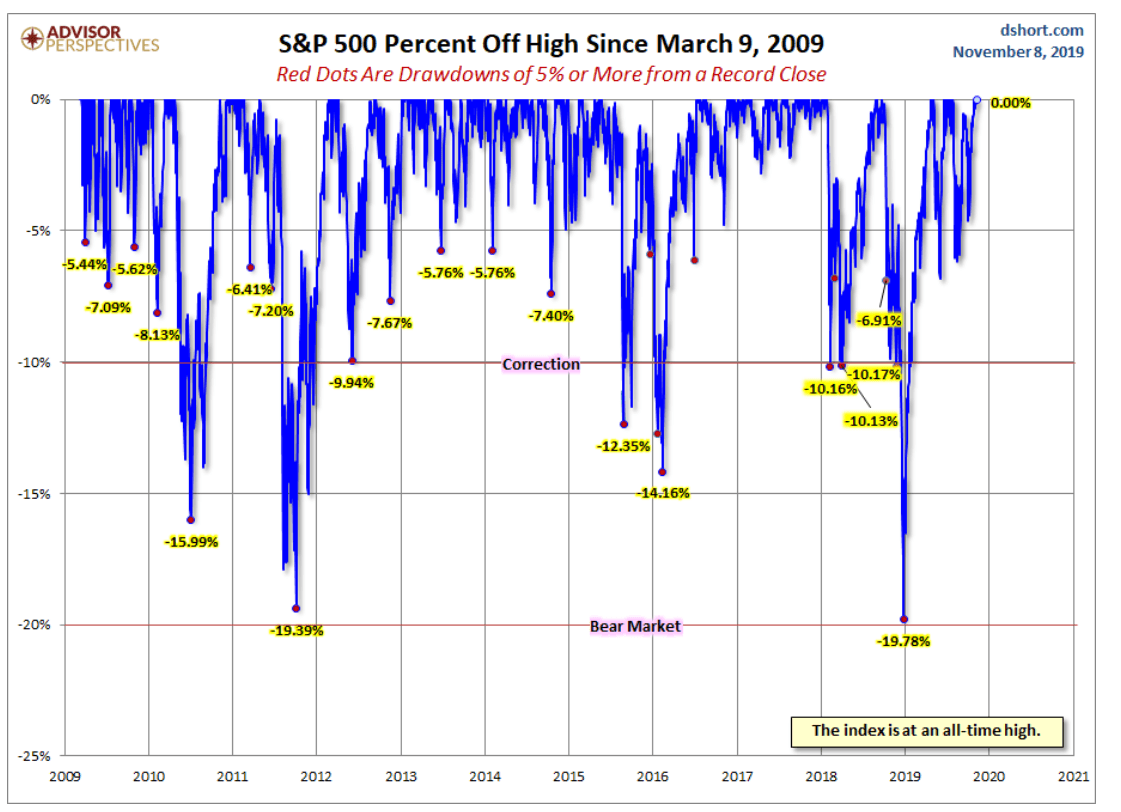
(Source: Advisor Perspectives)
The last pullback ended three weeks ago and means that historically speaking, we should expect another one to begin by the end of April 2020.
What does that mean for your portfolio?
How Investors Can Protect What They Have And Profit From the Coming Fear
(Source: imgflip)
The worst thing you can possibly do is make major portfolio shifts based on probabilities. That includes selling all your stocks in fear of normal and healthy downturns.

The average pullback lasts just one month, sees stocks fall 7% and then takes just two months to recover to record highs from the bottom. Corrections see about double the declines and last a total of nine months (three times as long), measured from a record high to record high.
No chart better encompasses the power of not panicking and trying to be “too cute” with your portfolio than this one.
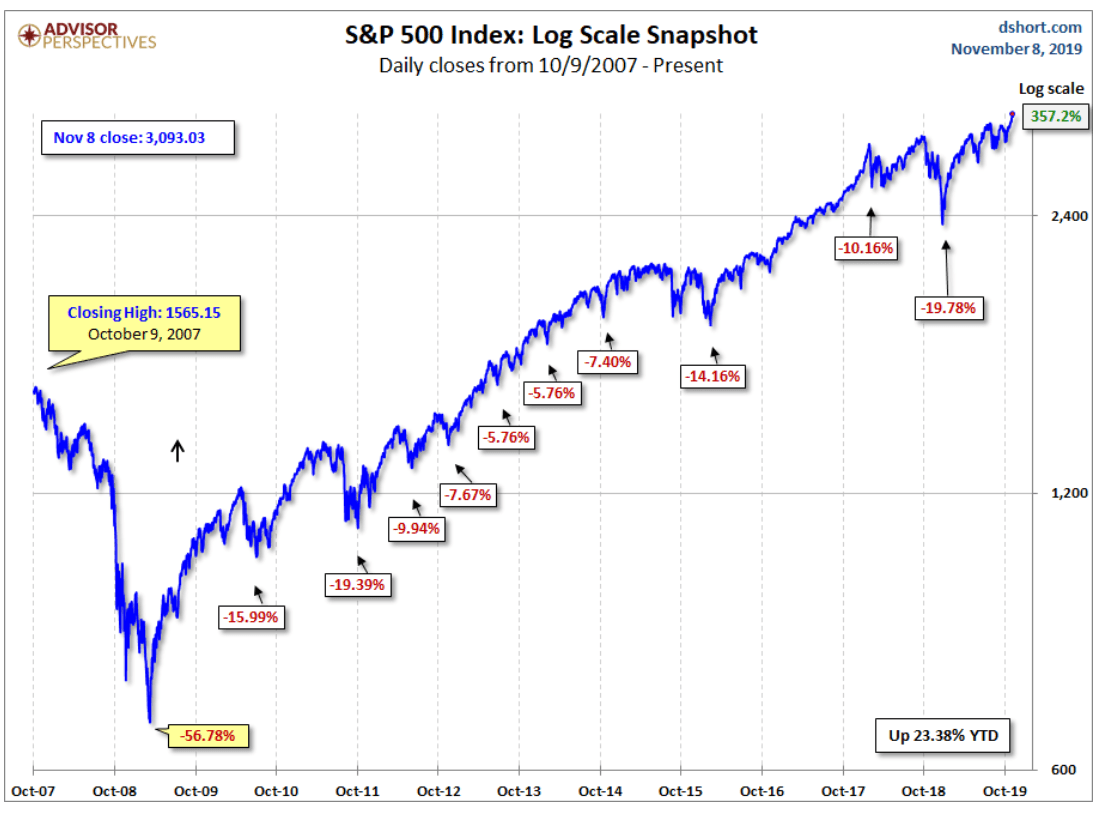
(Source: Advisor Perspectives)
Measuring from the 2007 October high, the S&P 500 has generated 357% total returns over the past 12 years. That’s despite a 57% market crash (mega-bear market) and 20 pullbacks and corrections.
In case you’re tempted to market time anyway, consider these words from Vanguard founder John Bogle.
Sure, it’d be great to get out of stocks at the high and jump back in at the low, but in 55 years in the business, I not only have never met anybody who knew how to do it, I’ve never met anybody who had met anybody who knew how to do it.” – John Bogle (emphasis added)
In theory, market timing could work. Morningstar did a study looking at returns from 1992 to 2011. They found that if you avoided the 10 worst days you’d have achieved 12% CAGR total returns instead of 7.8% CAGR from buying and holding.
BUT the trouble is that the 10 worst days cluster within two weeks of the 10 best days. Had you missed those 10 best market days your total returns would have fallen from 7.8% to just 4.1%.
(Source: Morningstar)
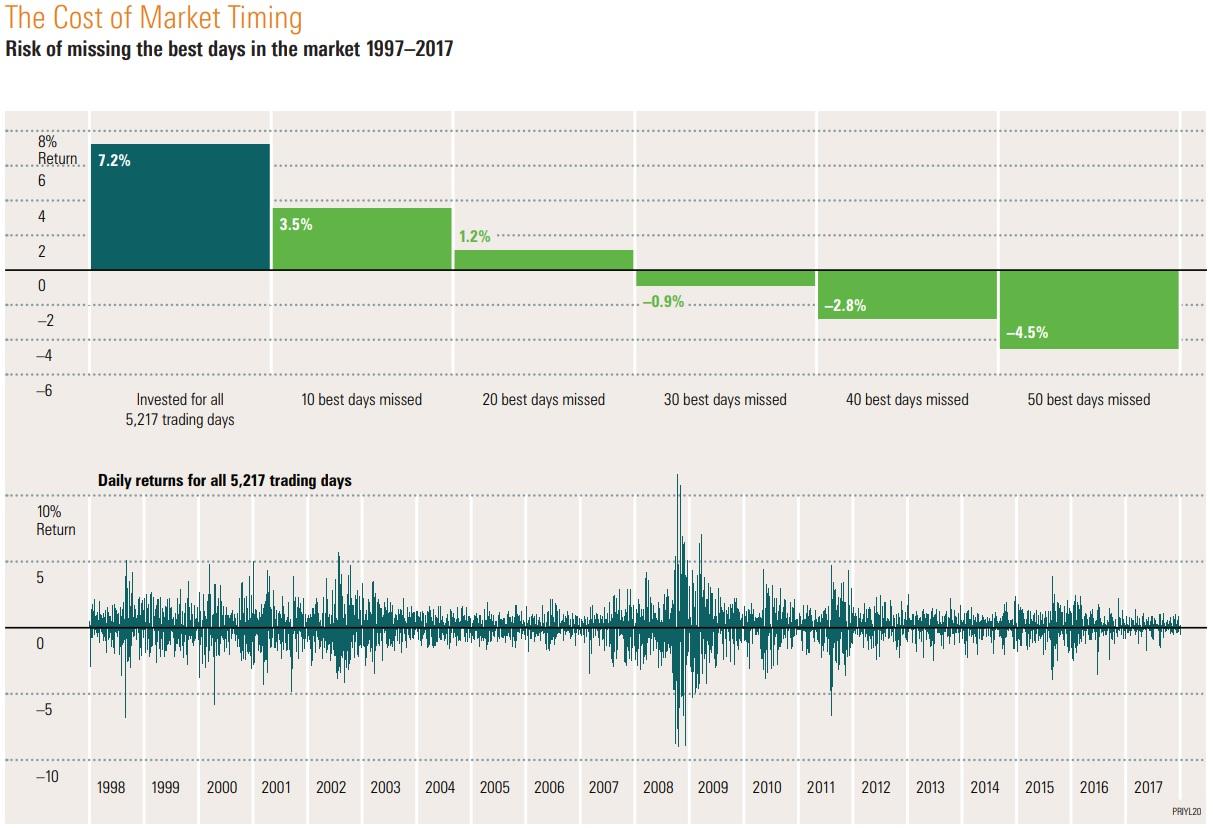
And that’s just the 10 best days. If you had missed the 30 best market days from 1997 to 2017 you’d have achieved slightly negative returns. Miss the 50 best market days and your portfolio shrank by 60% over half an investing lifetime.
If John Bogle, over his entire career never met anyone who met anyone who could time the market consistently, including Wall Street pros backed by an army of quants and supercomputers, what hope do you have?
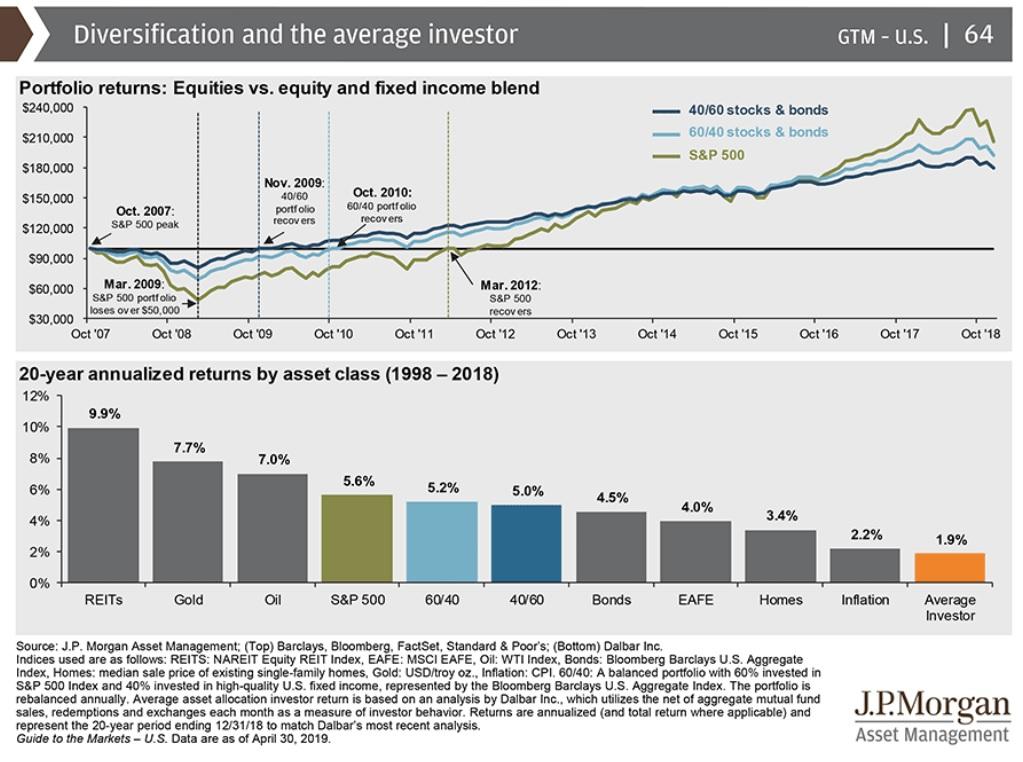
JPMorgan has the answer and it’s basically none. Over the last 20 years retail investors attempting to time the market by jumping in and out ahead of normal, healthy, and inevitable downturns, ended up losing to inflation, as well as literally every other asset class. Parking your money in risk-free bonds would have been a far better idea for those without the stomach for stock volatility.
But for those of who understand market history, including what normal valuations and volatility look like, we can prepare ourselves, financially, and emotionally to profit from every downturn.

(Source: AZ Quotes)
Dividend Kings, which I co-founded and for which I run four model portfolios, has used consistent weekly buying, which gets more aggressive during pullbacks, to great effect.
Dividend Kings Deep Value Blue Chip Portfolio
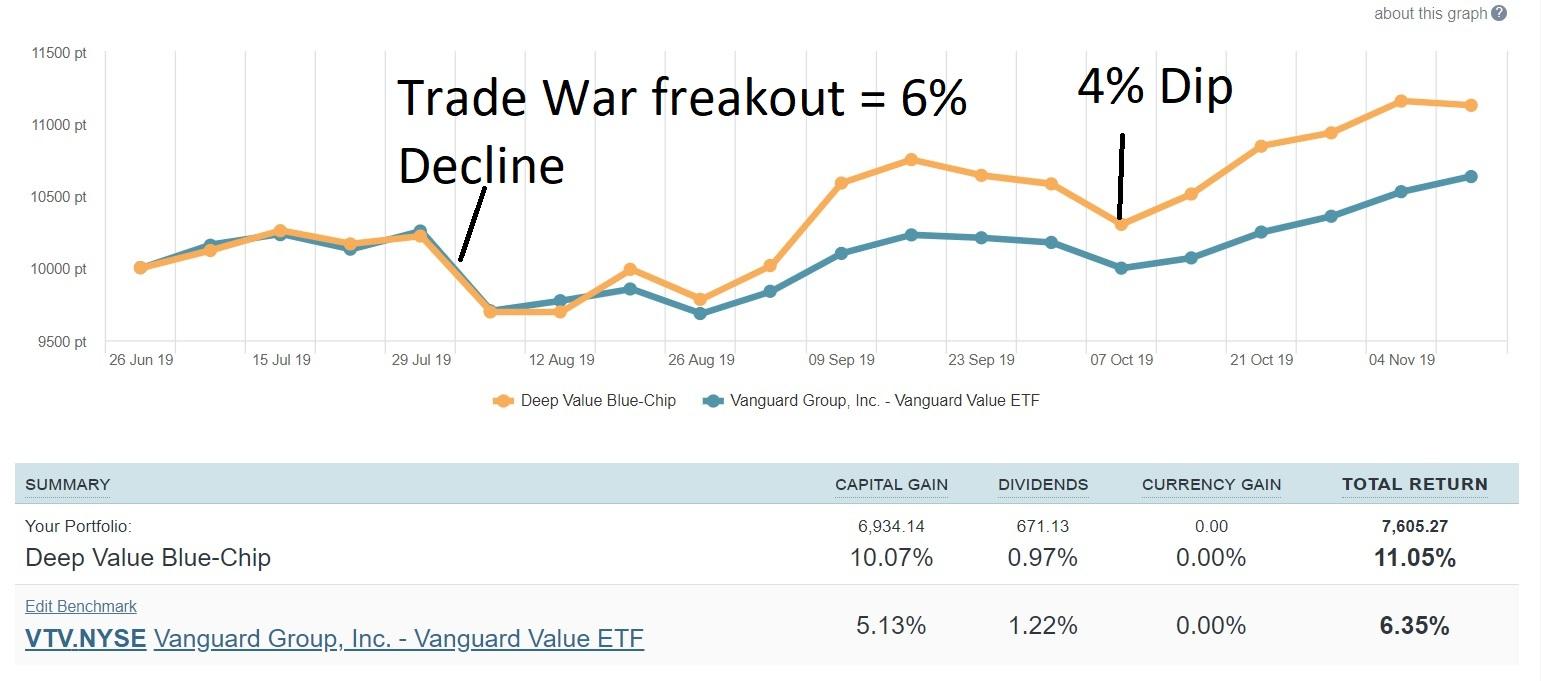
(Source: Sharesight)
While 17 weeks isn’t statistically significant you can see that this Dividend Kings’ portfolio has seen its fair share of volatility. Each time we used that to our advantage ramping up weekly buying in blue-chip undervalued companies like Caterpillar (up 21% for us), Skyworks Solutions (up 31%), and Marathon Petroleum (up 39%).
We fearlessly lowered our cost basis on quality companies whose thesis was firmly intact (that portfolio is 20% energy stocks) and took a contrarian approach to short-term market fear and pessimism.
Everyone wants a bargain…until it’s staring them in the face.
(Source: imgflip)
Dividend Kings, across all four of our portfolios (all which are beating their benchmarks so far) take the Buffett like approach. Not necessarily because we’re trying to beat the market, but purely to reach our overall portfolio goals.
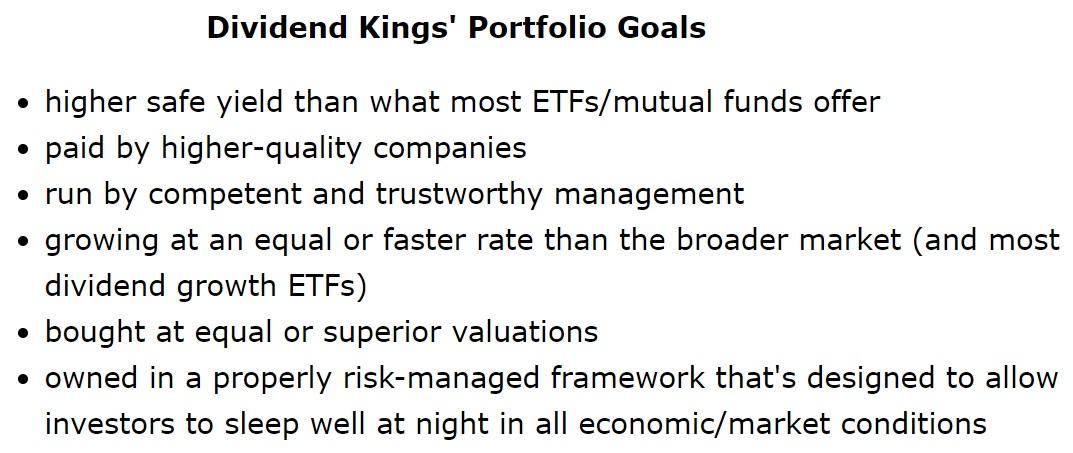
But guess what? Since 1956 the Gordon Dividend Growth Model (total returns = yield + long-term growth + valuation mean reversion) has been one of the most accurate return forecasting tools in the world.
If you combine higher yield, plus faster long-term growth, and superior valuation, along with other proven alpha-factor strategies (like quality and lower volatility) then achieving market-beating returns becomes a matter of patience, discipline and time.
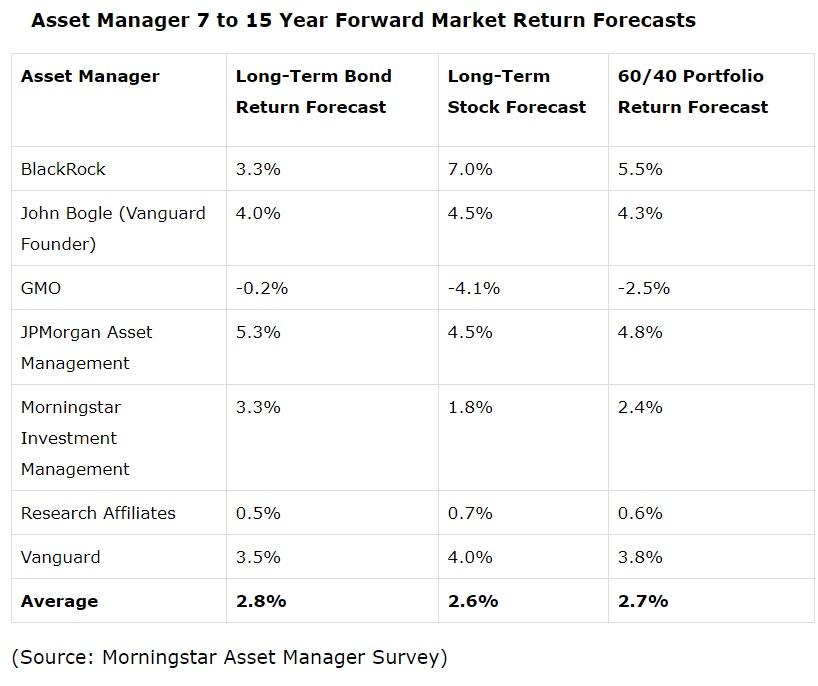
And that portfolio’s safe yield on cost is 5.4%, which means that our current dividends alone (which are expected to grow about 8.5 CAGR over time), are likely to outperform the weak future returns most asset managers expect from the broader market.
Bottom Line: Stocks Never Go Up in a Straight Line But Volatility Isn’t an Enemy But The Greatest Ally of the Prepared Investor
Don’t get me wrong, I’m not a market timer. I merely monitor broader market valuations, sentiment and the macroeconomic fundamentals to get a rough and approximate idea of when pullback/correction risk is elevated.
That’s not so I can sell all the stocks in my retirement portfolio or anything in the four Dividend Kings’ model portfolios we run for our members. It’s merely so we can prepare ourselves, both mentally, and financially, for any short-term volatility ahead.
Volatility is normal, healthy and what keeps the market from getting into dangerous bubbles that can result in truly frightening 50+% crashes as we saw during the tech wreck and Financial Crisis.
With the broader market now 10% overvalued, and market sentiment at euphoric levels, a pullback by the end of April 2020 is highly likely. It might come much sooner, especially if a phase one trade deal with China doesn’t materialize as expected in December.
Fortunately, a well constructed and risk-managed portfolio, like what Dividend Kings runs for its members, has nothing to fear from such volatility. In fact, we’ve been patiently preparing for a pullback/correction for five months. Each week we buy quality, undervalued companies that meet our individual portfolio goals.
But we also manage liquidity via buying slightly less than our incoming cash flow so that dry powder builds up precisely for times when market fear spikes, and high-quality dividend stocks go even more on sale.
That’s how I manage my retirement portfolio as well, using the same Master List of companies and risk management rules that safeguard the Dividend Kings’ portfolios.
Knowing market history and the core stats of the S&P 500 and broader market sentiment is a great way to make your own luck by emotionally and financially preparing yourself to profit from inevitable downturns we’ll face in the coming months.
SPY shares were trading at $309.84 per share on Tuesday morning, up $1.49 (+0.48%). Year-to-date, SPY has gained 25.71%, versus a 25.71% rise in the benchmark S&P 500 index during the same period.
About the Author: Adam Galas

Adam has spent years as a writer for The Motley Fool, Simply Safe Dividends, Seeking Alpha, and Dividend Sensei. His goal is to help people learn how to harness the power of dividend growth investing. Learn more about Adam’s background, along with links to his most recent articles. More...
More Resources for the Stocks in this Article
| Ticker | POWR Rating | Industry Rank | Rank in Industry |
| SPY | Get Rating | Get Rating | Get Rating |