
While everyone knows in theory that the stock market will be volatile at times, it’s one thing to know this fact, and an entirely different thing to live through a short-term market crash.
On March 9th, 2020, the S&P 500 opened down 7%, it’s third-worst opening in modern history, behind only 9/11 and the Financial Crisis.
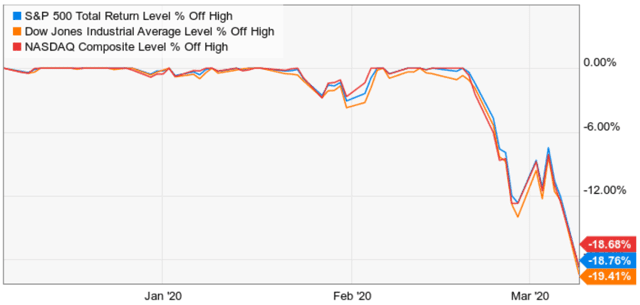
(Source: Ycharts)
As I write this the market is down almost 8%, and all three major indexes are flirting with bear market territory.
Understandably investors everywhere want to know, what caused this, how much worse could it get and how can I protect my portfolio?
This two-part series will attempt to address all these important questions, so that you can hopefully get through this latest bout of market panic, intact, and possibly richer than ever.
COVID-19 Pandemic Remains The Market’s Prime Concern

As with most complex issues, there is both good and bad news about the global coronavirus pandemic.
(Source: Johns Hopkins) – orange line = China, yellow line = non-China, green line= recoveries
On the plus side, China has reported just 700 new cases over the past week, meaning an average of 100 per day.

That’s good news not just because China represents about 20% of the global population, but also because, according to a John’s Hopkins study, it was the 51st most prepared country for a future pandemic.
If China is able to prevent the COVID-19 virus from spreading like wildfire throughout its massive cities (just 1 in 10,000 Wuhan residents has been infected so far) then that bodes well for the developed world’s efforts to prevent millions of cases.
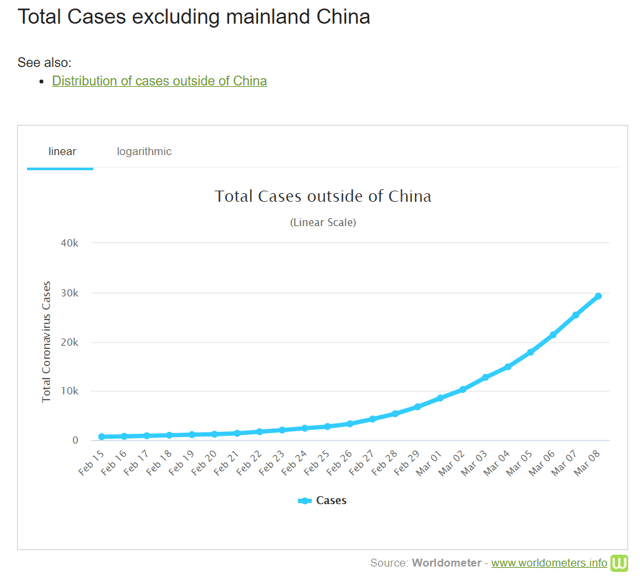
However, the bad news is that the virus continues to spread, almost entirely outside of China.
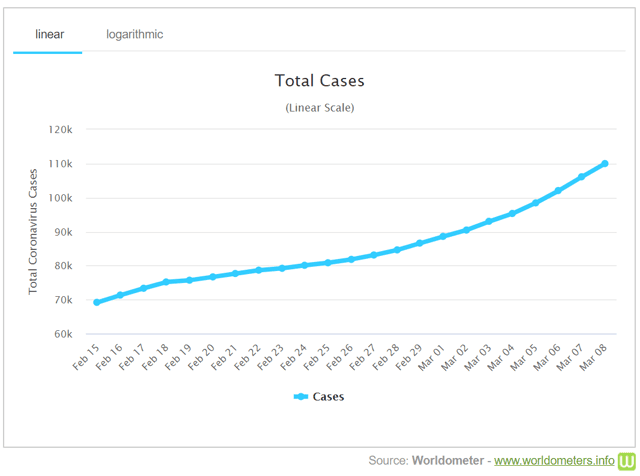
Not helping ease anyone’s fears is that we still don’t know that much about the virus itself.
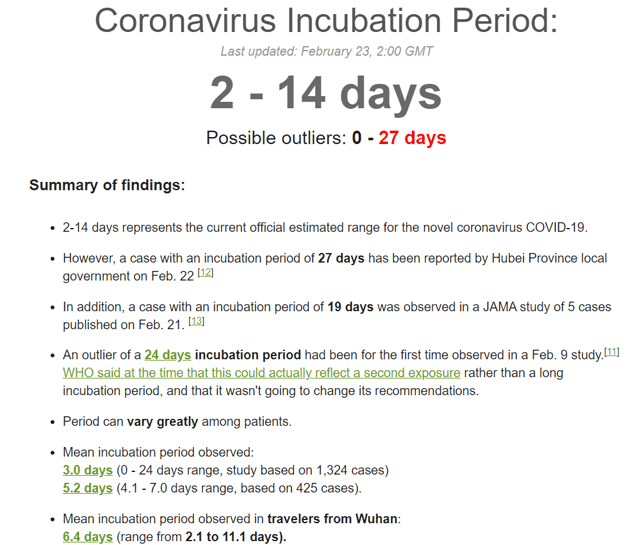
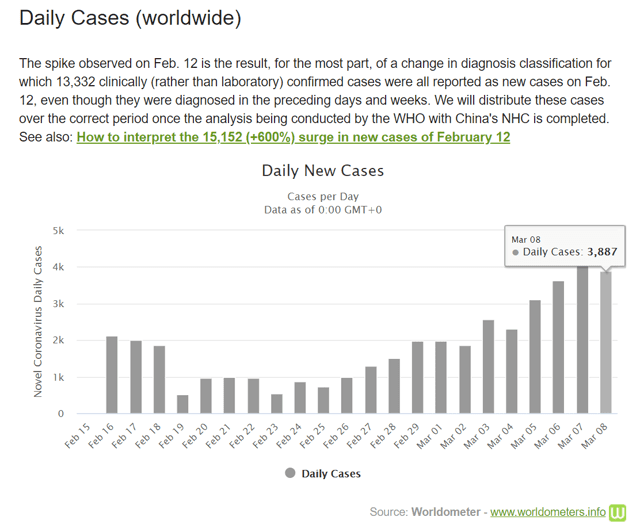
(Source: World of Meters)
For example, the current estimates of the incubation period are 2 to 14 days, but we’ve had reports ranging from zero to 27 days.
How long a person is able to spread the virus without showing symptoms is rather important to modeling how many people in total will get it.
This is a main reason why the media has been rampant with various reports ranging from Royal College London’s 2 million China case estimate (back in late January) to Harvard’s model that says that up to 70% of the globe might get the disease within 12 months (5.6 billion people).
The best thing that investors can do is avoid speculating about potential worst-case scenarios.
Here are the two most reputable sites for tracking the actual facts, as they come in each day. Remember that while models are useful if from a quality source, they must ultimately match up with reality.
Thus far the pandemic isn’t looking anything like 1918’s Spanish flu which killed between 2% and 5% of the world’s population (17 to 100 million people).
How do I know that? Because the Spanish Flu killed a disproportionate amount of young people including children. Their stronger immune systems overreacted to the virus drowning their lungs in fluids.
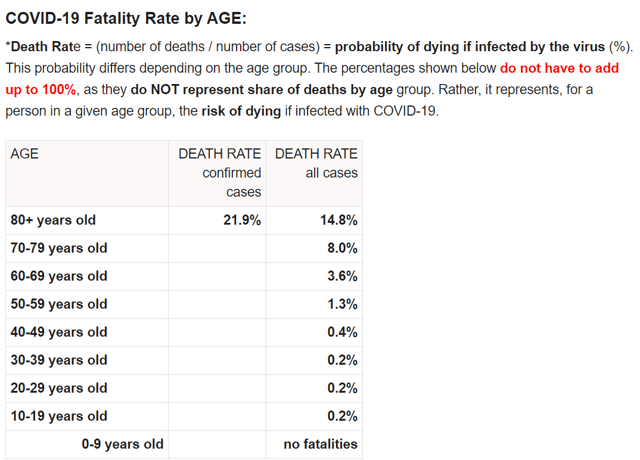
In contrast, COVID-19 has yet to kill a single child and 22% of deaths have been among the very elderly.
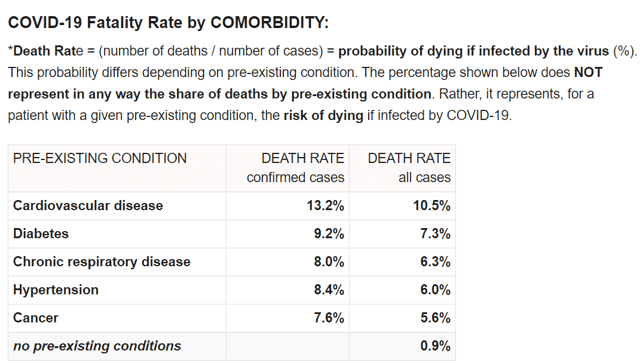
The fact that less than 1% of healthy people who get the disease die from it is a good reason to remain calm, and avoid panicking over your family’s safety.
Economic Impact Is Certain to Be Negative But How Bad We Just Don’t Know
It’s ironic that this market crash is coming just days after Friday’s blowout jobs report which showed 273K jobs created last month, and revised up the previous two months. The last three months have seen an average of 243K jobs, which is significantly higher than 2019’s impressive 172K.
For context, the Atlanta Fed estimates that 107K net new jobs are needed each month to keep up with population growth and thus keep unemployment at 50-year lows (3.5%).
The reason the market doesn’t care about the objectively great jobs report is simple. That survey was concluded in mid-February and COVID-19 began ramping up after that.
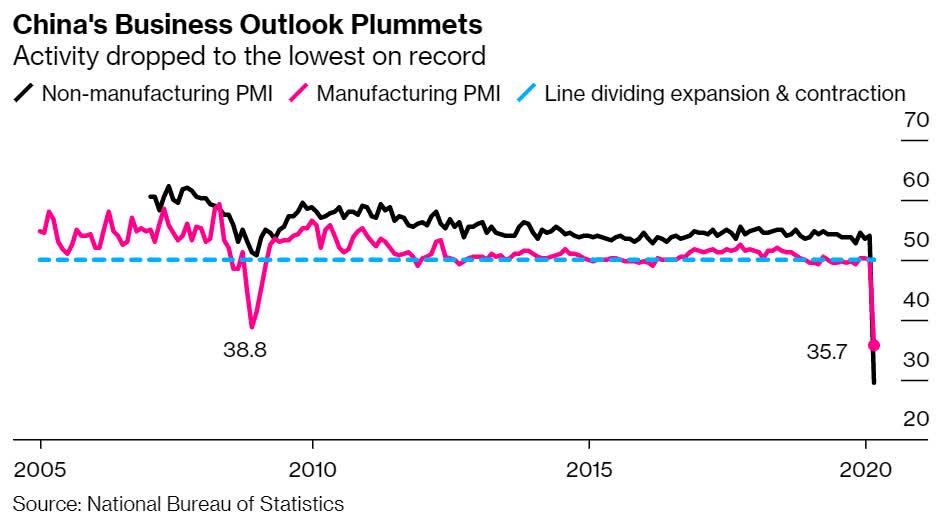
(Source: Bloomberg)
As you can see from China’s manufacturing and service PMI, fundamentals can deteriorate with frightening speed when dealing with a pandemic.
The reason for China’s rapid decrease in economic activity was quarantining 60 million people (about 4% of its population) and placing travel restrictions on 600 million.
Italy has just followed China’s lead announcing not just that it would close schools for three months, but quarantine 17 million people in the north of the country, a shocking 25% of the entire population.
Washington State has seen over 130 cases and is considering taking similar measures.
The main concern the stock market has with the epidemic is estimating what it will mean for global GDP and corporate earnings growth this year.
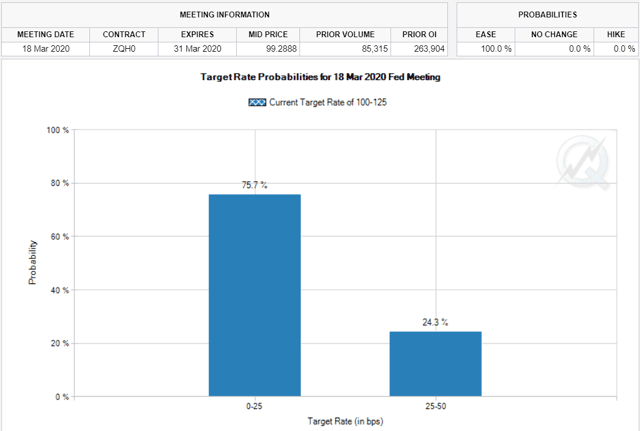
(Source: CME Group)
That’s why bond yields are crashing, including the 10-year yield hitting a new all-time record low of 0.32% today.
The bond market is now pricing in a 76% chance that the Fed will cut rates on March 19th all the way to zero.
A 1.75% rate cut in two weeks is truly astounding and something no analysts were expecting a few weeks ago. Why would the Fed potentially be willing to effectively cut seven times so quickly?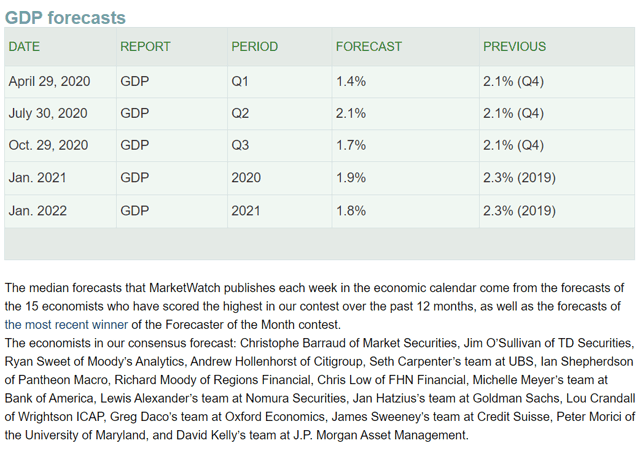
(Source: MarketWatch)
At first glance, the consensus GDP forecasts from the 15 most accurate economists tracked by MarketWatch don’t look scary at all. But remember that we’re dealing with a lot of unknowns right now and other analysts have less optimistic forecasts.
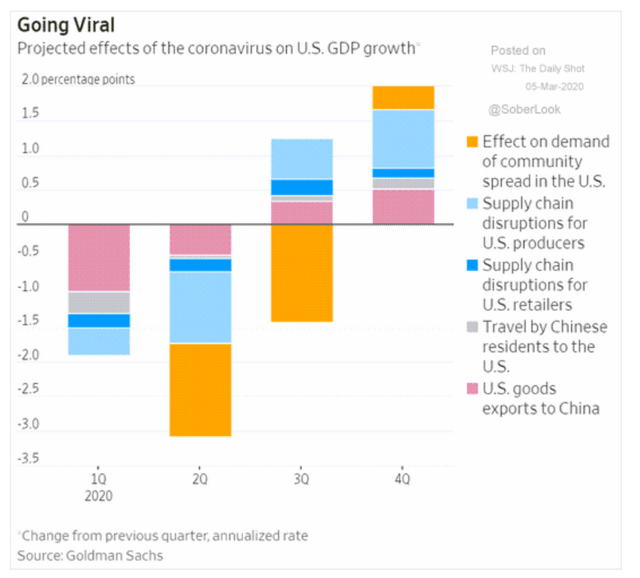
Goldman Sachs estimates that in Q1, the COVID-19 pandemic will knock US GDP growth down by 2%, followed by a 3% decrease in Q2.
If we apply those figures to the earlier consensus GDP forecast then this is what US GDP growth might look like in 2020.
- 2.1% – 2.0% = 0.1% growth in Q1
- 1.5% -3% = -1.5% growth in Q2
- 2.3% – 0% = 2.3% growth in Q3
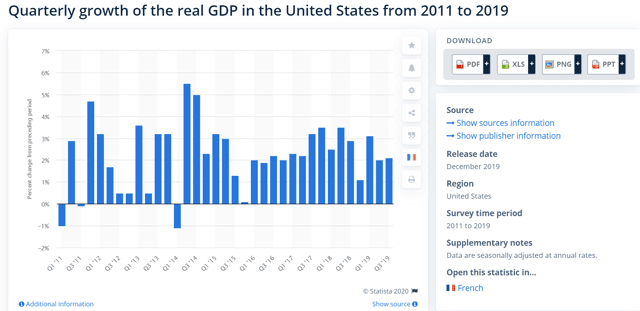
(Source: Statista)
Depending on what the economic data says in the next two months we could potentially narrowly avoid a recession or, experience a short and mild one.
We’ve had three negative quarters of GDP growth since 2009, so a single bad quarter is not itself that concerning. Especially given that Goldman agrees with The Harvard Business Review that the supply chain disruption (hurting manufacturing) will be fully gone by Q3.
But we also can’t forget corporate earnings growth. Before the pandemic, the FactSet consensus was for 11% EPS growth in 2020.
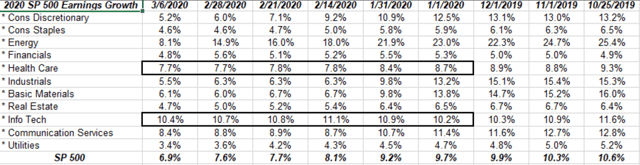
(Source: Brian Gilmartin)
Combined with low-interest rates that was the theoretical justification for the market’s strong 2019 rally which lasted until February 19th, 2020. However, as you can see consensus forecasts have been falling steadily for weeks now.
Energy especially will face a very rough year, with likely negative EPS growth that will drag the overall S&P 500 average down.
FactSet’s consensus 2020 EPS forecast is down to 6.4%, while IBES/Refinitiv/Lipper Financial’s is for about 4% (the above is an average, not weighted).
However, Goldman Sachs now expects zero EPS growth in 2020…if we avoid a recession.
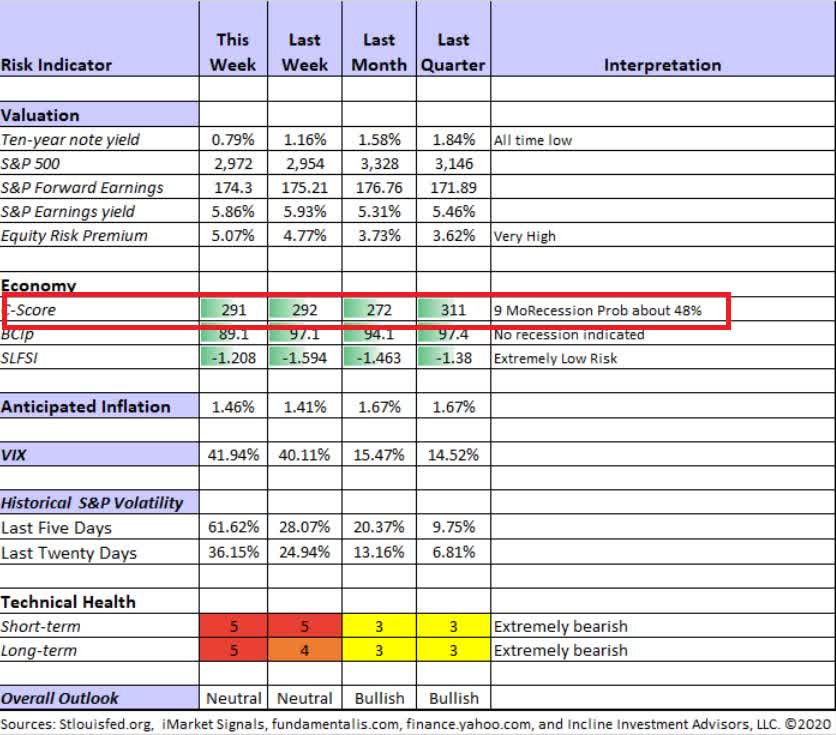
(Source: Jeff Miller)
Jeff Miller’s 9-month recession risk model is based on a meta-analysis of several models and is more dynamic than most other models. It currently agrees with Moody’s that we have about 50% risk of a recession in 2020, which lines up with what Goldman’s COVID-19 model is saying.
In the event of a recession EPS growth, according to both Goldman and Bank of New York Mellon, might fall 13%.
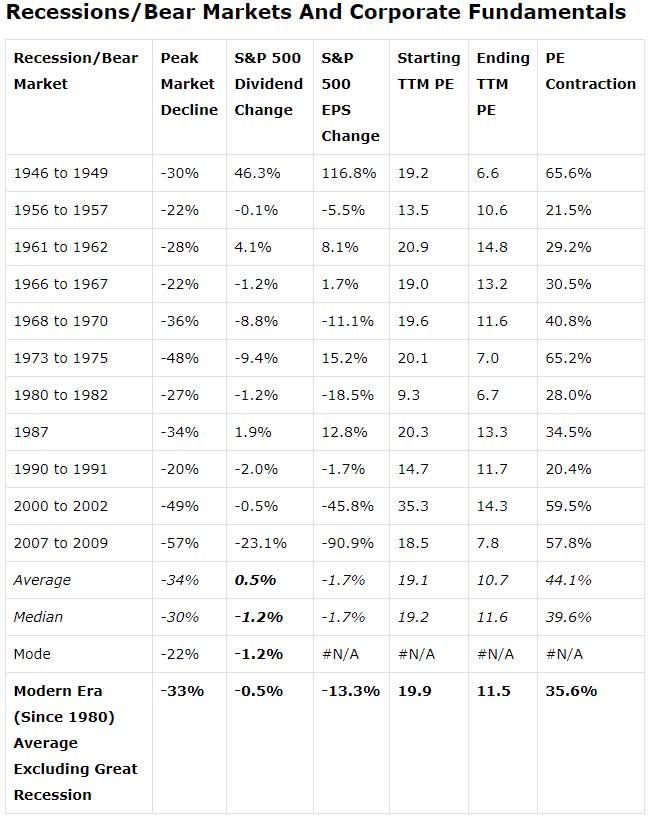
(Sources: Moon Capital Management, NBER, Multiple.com)
13% EPS contraction happens to be the average EPS decline during recessions since 1945, which might explain why two leading asset managers are using it.
Basically, the reason the market was in a correction in the first place was the high degree of uncertainty surrounding whether we get decent (up to 7%) EPS growth this year, or pretty awful (-13%). That is what determines whether the current correction makes stocks reasonably priced (16.3 PE) or still overvalued and potentially set to fall further.
In part two of these series, I’ll take a look at the major reason the market correction turned into a panic that threatens to become a bear market. I’ll also address what might be coming next, and how you can protect your portfolio from potentially costly mistakes that could torpedo your dreams of a prosperous retirement.
SPY shares were trading at $284.97 per share on Tuesday morning, up $10.74 (+3.92%). Year-to-date, SPY has declined -11.46%, versus a % rise in the benchmark S&P 500 index during the same period.
About the Author: Adam Galas

Adam has spent years as a writer for The Motley Fool, Simply Safe Dividends, Seeking Alpha, and Dividend Sensei. His goal is to help people learn how to harness the power of dividend growth investing. Learn more about Adam’s background, along with links to his most recent articles. More...
More Resources for the Stocks in this Article
| Ticker | POWR Rating | Industry Rank | Rank in Industry |
| SPY | Get Rating | Get Rating | Get Rating |


