

Sell In May? No Way.
Investment adages that rhyme seems to occupy a special hold in people’s brains, and with the recent run-up and still lingering COVID-19 concerns, the advice to “sell in May and Go Away” has taken an especially firm perch in people’s minds.
What better time than now to lighten both your financial and emotional load and enjoy summer as best you can. The phrase is just one of many based on seasonality trends first popularized by Yale Hirsch in his book, The Stock Trader’s Almanac.
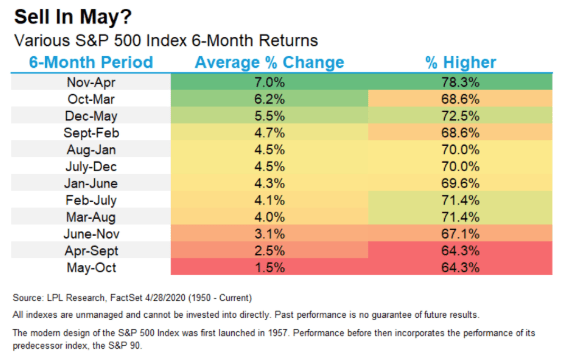
The theory is rooted in historical research which shows that stocks tend to experience their worst performance between the months of May and October. Alternatively, the best months of the year typically occur between November and April. Notice how significant the disparity in average return is between these two six month timeframes.
JC Parets at All Star Charts has done a great job digging into the details.
Over the past 70 years, the six-month period, starting in November ranks higher than any other rolling six months in both average return and the percentage of occurrences the market is higher. Likewise, the six months starting May 1st (that’s today!) rank lowest by both of these same measures.
Most US Equity Indexes broke above multi-year highs in late October/early November of last year and went on to rally into the middle of Q1. Things were looking good for stocks and their strong performance made sense within the context of the seasonal trends we’re discussing. Then we experienced an unprecedented selloff and equally impressive rally in the time since.
The stock market just had its best month since 1987 but that means nothing for this exercise as we need to analyze the full six month period. Here are the “best six months” returns for a variety of major averages, factors, and sectors in the US.
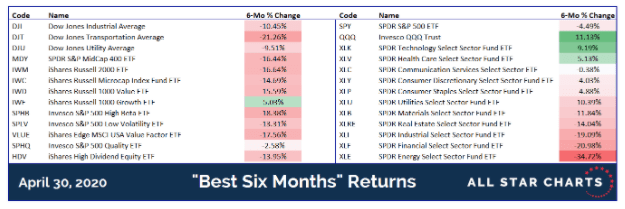
The main takeaway should be simply that there is a lot more red than green in this table, but here are some highlights.
- The average ETF in this table is down by roughly -10%.
- Of all the major averages, only the Nasdaq 100 (QQQ) was positive.
- Risk-on areas such as Transports (DJT) and Small-Caps (IWM) were among the worst performers, losing -21% and -17%, respectively.
- Growth (IWF) was the only positive factor with High Quality (SPHQ) close to breakeven. The remaining five were all lower by at least -13%.
- The only positive sectors were Technology (XLK) and Health Care (XLV). Cyclical sectors lagged noticeably.
I know what you’re thinking… If that was the “best six months,” what are Equities going to do during the worst six? Probably not too well.
The reason we analyze this seasonal trend is not so we can buy stocks In November and sell them in May. Please don’t do that. That is a fool’s errand and not at all how this information is intended to be used.
The real value comes from measuring the current years’ seasonal performance relative to its historical trend. In comparing the present stock market to its historical tendencies, we can identify divergences that provide insight into the future performance of the market.
For example, one of the most effective seasonal indicators is when the market performs poorly during what is supposed to be its strong season, as it just did.
The fact that the S&P 500 fell -4.5% during what was supposed to be its strongest season tells us there is a good chance it will continue to struggle during its weakest season. This simply adds to the weight of the evidence we’re already seeing which makes us believe US equities are likely to remain under pressure for the foreseeable future.
Want More Great Investing Ideas?
9 “BUY THE DIP” Growth Stocks for 2020
REVISED 2020 Stock Market Outlook– Discover why there is more downside ahead and the Top 10 picks for the bear market.
9 Simple Strategies to REGROW Your Portfolio – Learn the 9 strategies employed by Steve Reitmeister to generate consistent outperformance…even during bear markets.
SPY shares were trading at $288.99 per share on Tuesday afternoon, up $5.42 (+1.91%). Year-to-date, SPY has declined -9.68%, versus a % rise in the benchmark S&P 500 index during the same period.
About the Author: Option Sensei

Steve has more than 30 years of investment experience with an expertise in options trading. He’s written for TheStreet.com, Minyanville and currently for Option Sensei. Learn more about Steve’s background, along with links to his most recent articles. More...
More Resources for the Stocks in this Article
| Ticker | POWR Rating | Industry Rank | Rank in Industry |
| SPY | Get Rating | Get Rating | Get Rating |


