In the first part of this two-part report, I explained why if we can ramp up US testing capacity by 100% to 200%, then we might be able to restart the economy (phase one of three) within the next few weeks (with specific dates for each state).
That’s in time for the July 1st deadline, most economists have used to model the worst recession in history, at least in terms of peak quarterly decline.
Economic Recovery Forecasts
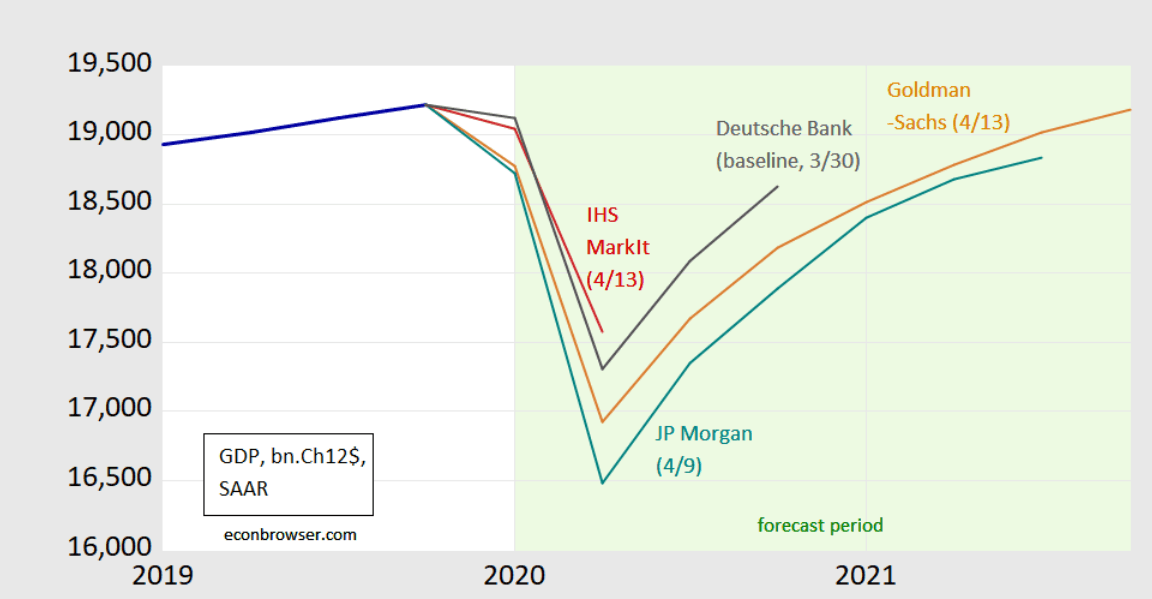
The so-called “v-shaped recovery” won’t necessarily remain v-shaped but compared to -40% to -50% GDP growth in Q2, positive growth of any kind will seem spectacular by comparison.
Indeed, JPMorgan’s -40% GDP growth forecast in Q2 is then expected to be followed by +23% and +13% GDP growth in Q3 and Q4, respectively.
+23% growth in a single quarter (on an annualized basis) would be the fastest growth in US history or at least modern history. Back in the 1800’s the US was an emerging economy that frequently experienced single year GDP booms and busts of 20% or even 30%.

(Source: The Balance)
The point is that 20+% of potential growth in Q3 would be on par with some of the best growth the US has ever experienced as a mature economy.
In yesterday’s part one of this report “Here Is When America Can Potentially Restart Its Economy” I explained the best estimates that Federal and state officials have of when it MIGHT be safe to begin phase one of the three-phase restart plan.
(Source: Ycharts)
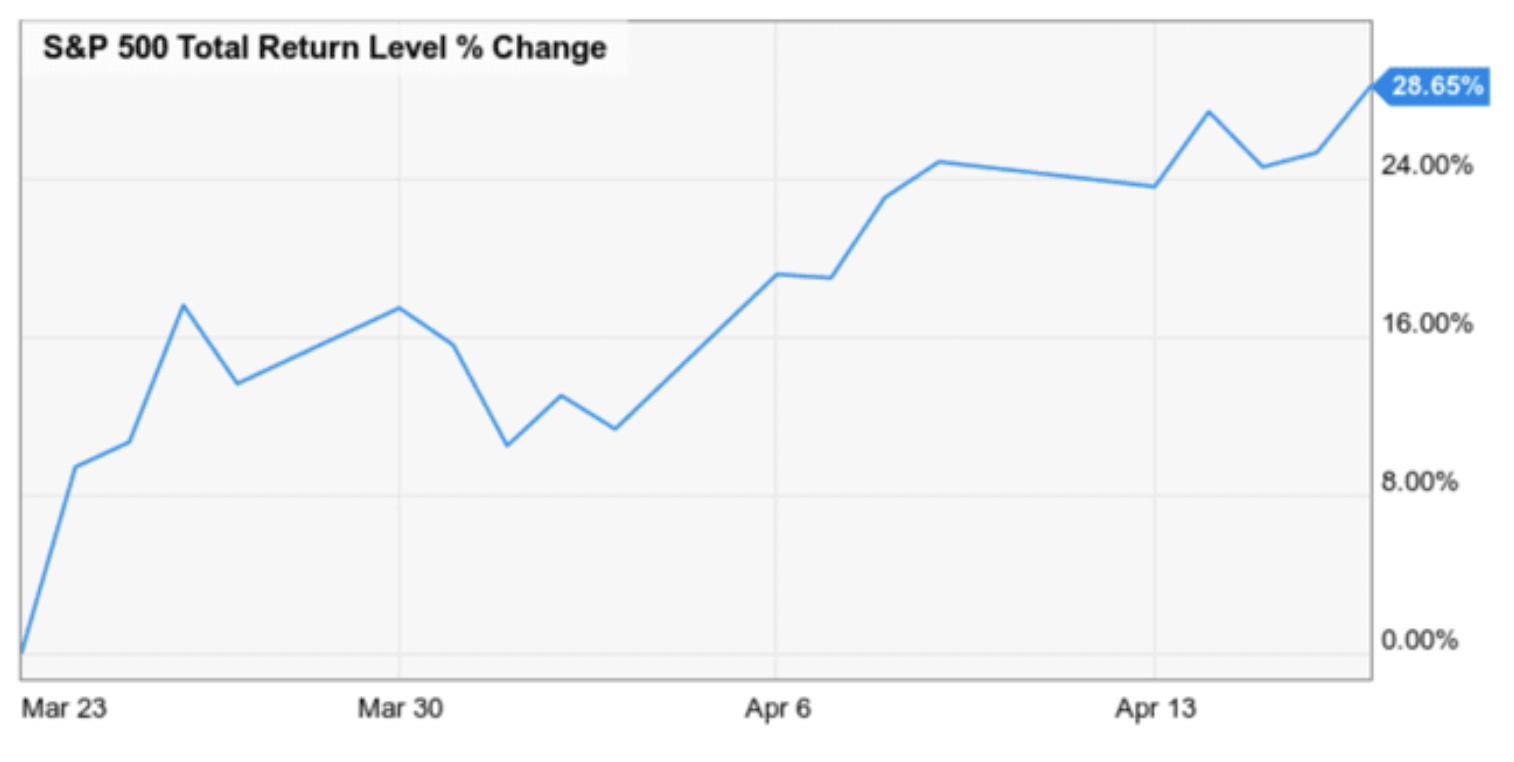
A potent combination of Federal and Congressional stimulus combined with optimism about the pending potential economic restart is what’s allowed the S&P 500 to stage one of the most impressive rallies off its recent bear market low (so far).
In fact, so strong has the bullish outlook of recent weeks been that even when oil crashed 400% on April 20th (traded negative for the first time in history), vs the previous record of -33%, stocks were basically unphased.
(Source: imgflip)
But in the spirit of warning you against irrational exuberance, allow me to explain the two biggest reasons that stocks are not likely to continue this rally.
In fact, there is a very high risk of a 10% to 20% correction in the coming weeks or months, that could send many investors into a dangerous despair that could result in costly mistakes.
Let’s take a look at why the next few months are likely so dangerous, and what you can do to avoid painful mistakes that could potentially damage your ability to achieve your long-term financial goals.
The Economic Recovery Is Likely To Be Longer Than Many Hope
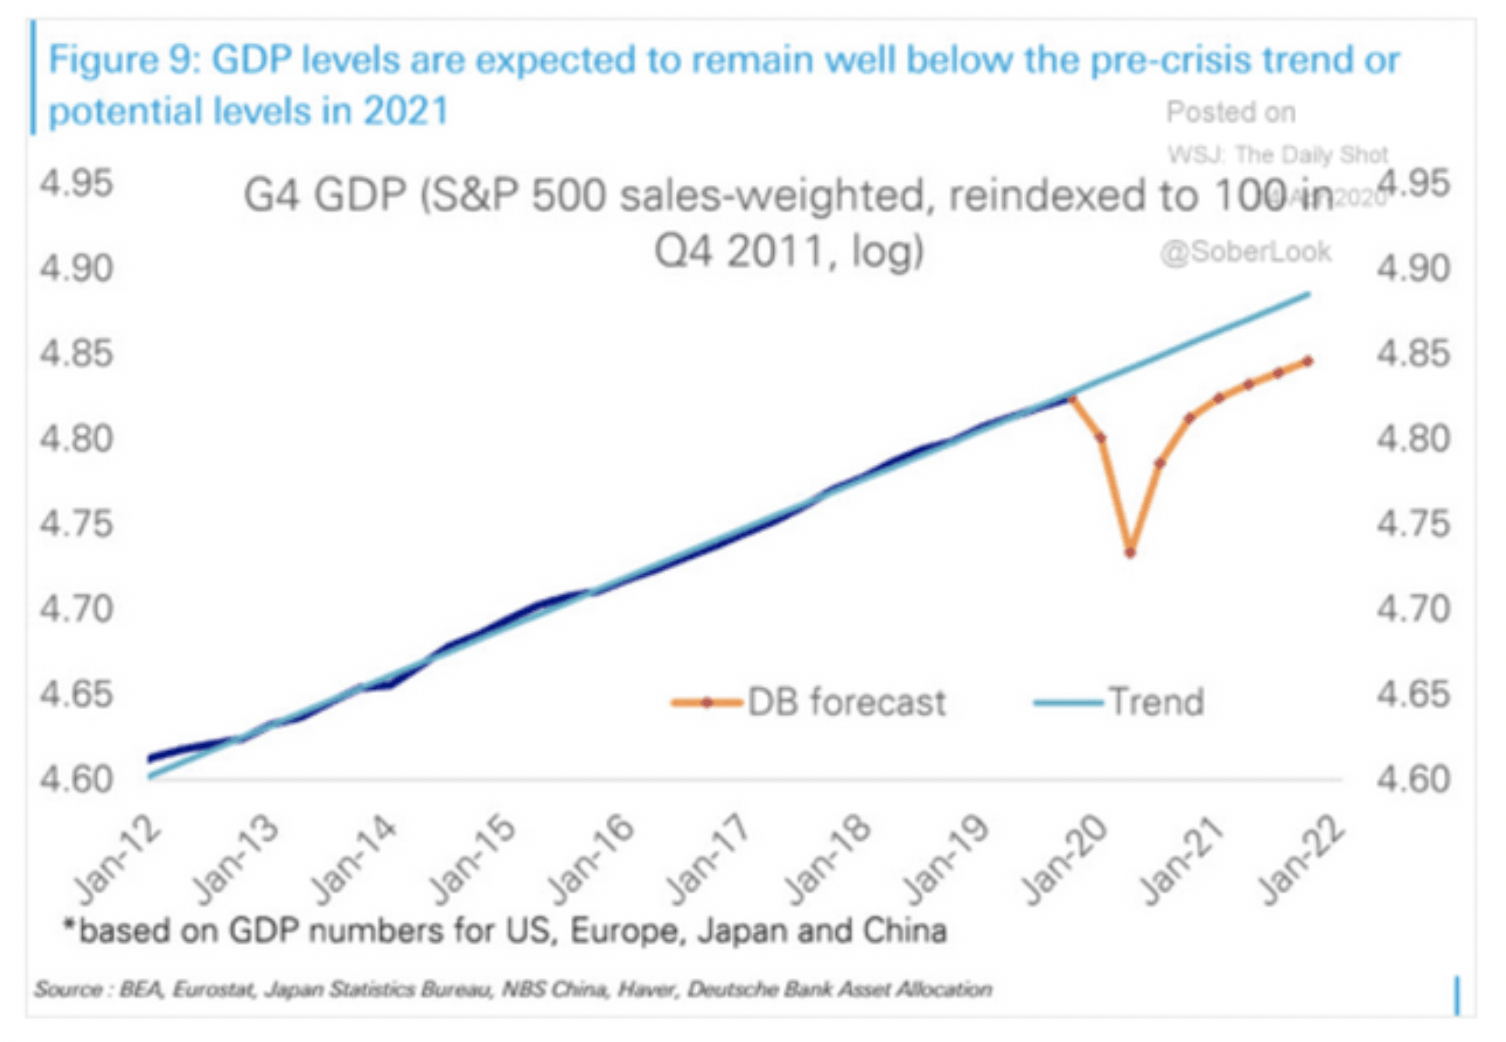
While the rebound growth we’re likely to see in Q3 and Q4 if we achieve the expected phase one restart data is impressive, the consensus among top economists is that it will take years for the US to recover from what the IMF is calling “the Great Lockdown” recession.
Why is that? Most likely because of the devastation done to the labor market in recent weeks, which is likely to keep getting worse until we actually begin to restart the economy.
Just how bad has this recession been for the job market? 22 million new unemployment claims in the last four weeks. For context, we created 22 million jobs over the last 11 years and then lost them all in a month.
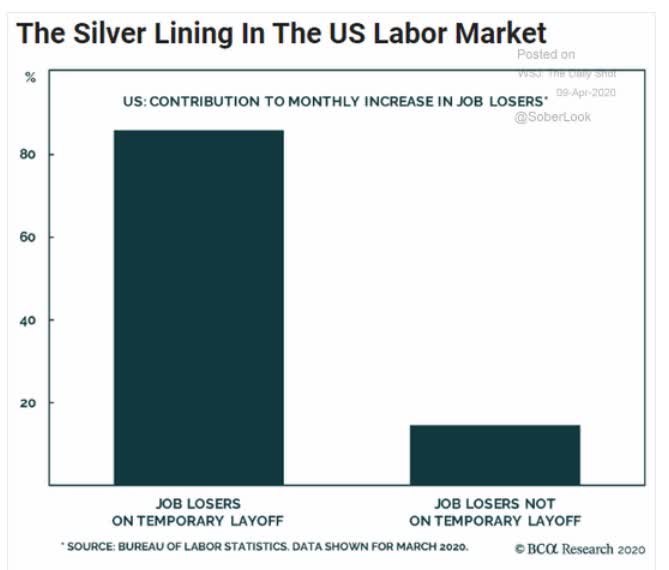
Now, the good news is that according to the Bureau of Labor Statistics 85% of the job losses so far are temporary furloughs.
The bad news is that the St. Louis Fed is estimating 37 to 57 million total job losses in Q2, with a 47 million base case resulting in 32% to 40% peak unemployment.
- 15% of those losses are permanent = 7.1 million
- 30% of those losses are permanent (JPMorgan estimate) = 14 million
- Great Recession losses: 8.8 million (over 23 months)
What about the strong recovery in Q3 and Q4 as well as impressive growth in 2021?
- up to 32% to 40% peak in Q2 (St. Louis Fed)
- 14% unemployment at the end of 2020 (JPMorgan)
- 9% unemployment at the end of 2021 (Congressional Budget Office)
Even by the end of 2021 unemployment is forecast to be nearly as bad as March 2009, when it peaked at 10% following the Great Recession.
That is going to weigh on consumer confidence for many years, even if the economic rebound courtesy of restarting the economy goes as expected.
But it may not!
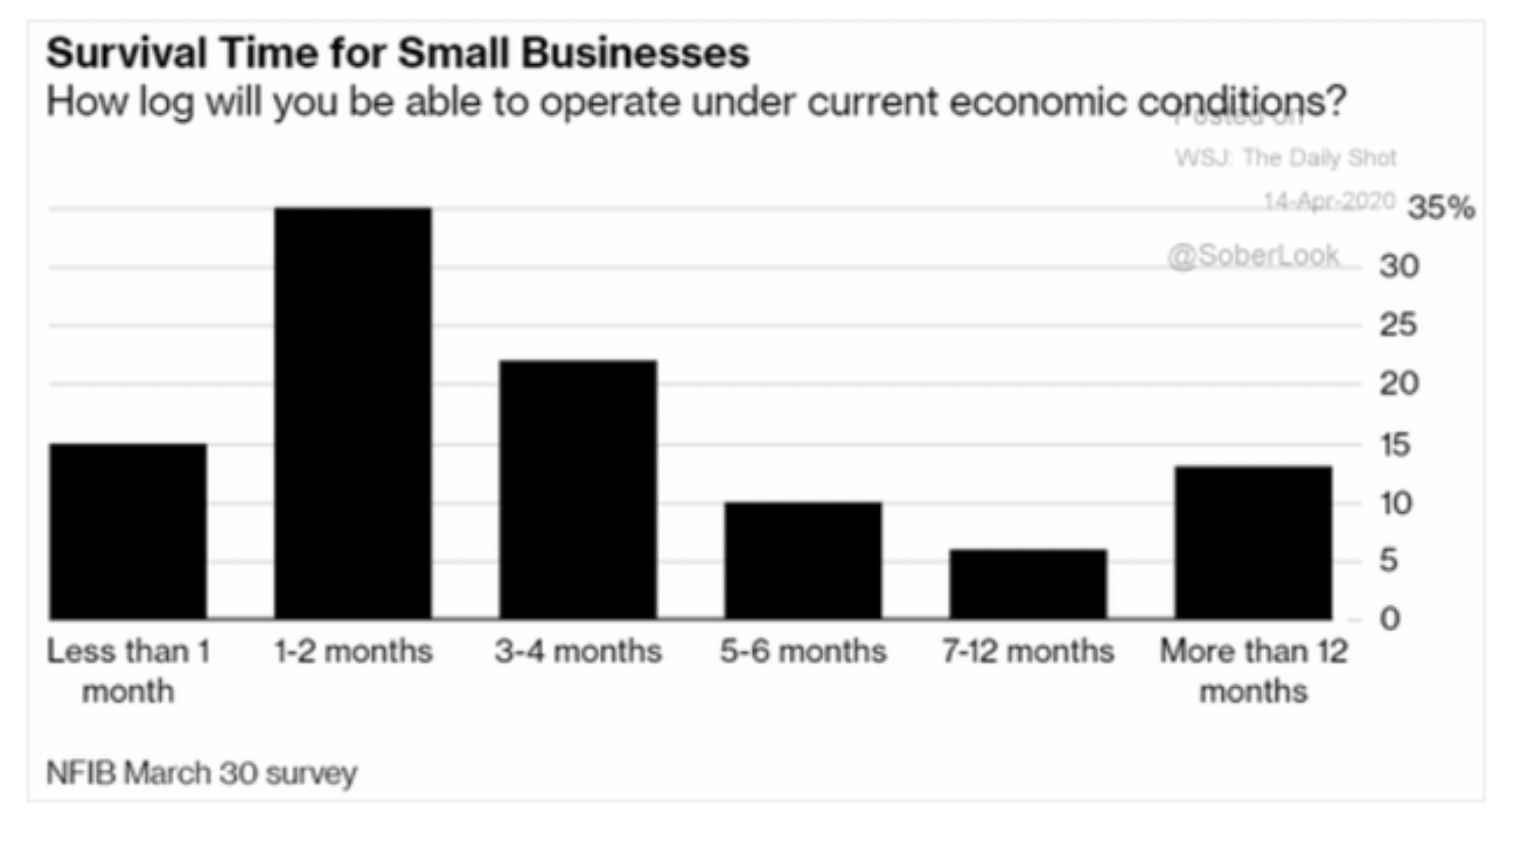
An estimated 50% to 60% of all US jobs are from about 30 million small businesses. Businesses that JPMorgan estimated before the pandemic had an average of 27 days of cash reserves (restaurants 16 days).
50% of small business respondents that told the National Federation of Independent Businesses on March 30th that they could only survive for the next 2 months or less under current economic conditions.
Congress has authorized $350 billion in small business loans under the Payroll Protection Plan and the Fed has said it will lend up to $600 billion to small and medium-sized businesses.
But the PPP ran out of Money on April 15th and the Senate is working on a $300 billion extension with a vote scheduled (preliminary plan) for April 21st.
The House might be able to vote for its on April 22nd, but literally thousands of small businesses are dying each day they don’t get aid.
The University of Washington estimates that the PPP, in order to cover all 30 million small businesses in America for 2.5 months (as it was designed to do) would require $3.7 trillion.
This basically means that despite the impressive size of the stimulus (the largest in history by far) including over $1 trillion pledged to support small and medium-sized businesses (PPP + Fed), it’s still a drop in the bucket of what’s needed.
Does that mean we’re facing a small business apocalypse? Not necessarily.
According to Howard Mason, Head of Financial Research at Renaissance Macro Research, $1.8 trillion in PPP loans might be needed which means Congression will have to act as fast as possible to prevent a large wave of small business failures in this country.
In other words, about 50% of small businesses can likely survive without assistance from the government until we begin restarting state economies.
A large amount of those that would die without aid will get it, though we can’t know how many until months from now, once the data is in.
The median consensus for this Thursday’s new unemployment claims is 4 million, which would put the five-week tally for job losses at 26 million if it’s accurate.
That’s about halfway to the St. Louis Fed’s estimate of the total (and mostly temporary) job losses from this recession. But the point is that we will have to wait for months to know how many small businesses have failed, and how bad the job carnage will ultimately get.
And we’ll have to wait likely until the end of the year, when the US is in phase three, to see how rapidly unemployment comes down, to determine how accurate those unemployment and growth models will be for 2020 and 2021.
The kind of job/economic risks we’re facing is unprecedented in US history (or human history in terms of absolute numbers). Yet stocks are rocketing higher as if the Great Lockdown recession was over and the damage had proven less severe than we’d feared.
Corporate Earnings Are Diving And Stocks Are Now The Most Expensive In 20 Years
Goldman Sachs is predicting that in Q2 earnings will decline by 123%, turning negative (and then grow 27% in Q3 and 55% in 2021)
Latest S&P 500 EPS Growth Consensus Through 2022

(Source: Brian Gilmartin, Lipper Financial)
Brian Gilmartin, of Trinity Asset Management, reports the range of 2020 EPS estimates for the S&P 500 he’s seen range from $110 to $145. $145 is currently the Lipper Financial consensus from all analysts covering the broader market.
In the last 7 weeks, S&P 2020 consensus estimates have fallen 21% and they show no sign of slowing down yet.
Is it true that 2021 and 2022 are expected to be strong growth years? You bet.
Is it true that 2021 and 2022 estimates have been rising as 2020 estimates have been falling? Absolutely, because the worst earnings growth is this year, the more impressive the comps will be in the future.
However, let’s look at some simple math.
- 2020 Lipper Financial Consensus: $145 ($165 in 2019)
- 2021 Lipper Financial Consensus: $178
- 2022 Lipper Financial Consensus: $200
The S&P 500 closed at 2875 on April 17th representing
- 19.7 times forward PE (2020 consensus)
- 16.2 times 2021 recovery earnings
- 14.4 times 2022 earnings
The 25-year average forward PE is 16.3, meaning that stocks are now about 21% historically overvalued. On February 19th, the bull market peak, they were 19.3, the highest valuations in 18 years.
Stocks are now at their richest levels in 19 years AND if earnings expectations hit $125 or $110 (Goldman’s estimate)? Then they could reach a forward PE of 23 and 26, respectively.
The Tech bubble peak was a forward PE of 27.
Am I saying that stocks are set to crash 50% from here? Absolutely not. What I am saying is that right now the broader market is pricing in all of 2021’s expected recovery earnings, which assumes the pandemic recovery will go as expected (far from guaranteed).
I’m also saying that, assuming the market returns to its historical 16.3 forward PE by the end of 2022 (valuations tend to mean revert over time) then the potential upside for the broader market is about 14%…over the next 2.75 years.
And in the short-term? Correction risk, not necessarily a return to previous lows, but a 10% to 20% decline, is very high for the next few months.
Even if the market doesn’t go up, and merely trades flat, falling earnings expectations will likely make stocks steadily more expensive based on fundamentals, which remain at their most uncertain since the Financial Crisis, and in some cases, ever.
So how can a prudent investor deal with such uncertainty, balancing regular fear with a fear of missing out on some of the best deals we’ve ever seen in some blue chips?
How I’m Protecting My Nest Egg From The Dangerous Of Market Timing And Irrational Emotions
All investing involves taking risks because no one knows the future. So, the first step in achieving your long-term goals is prudent risk management that’s appropriate for your personal risk profile and goals.
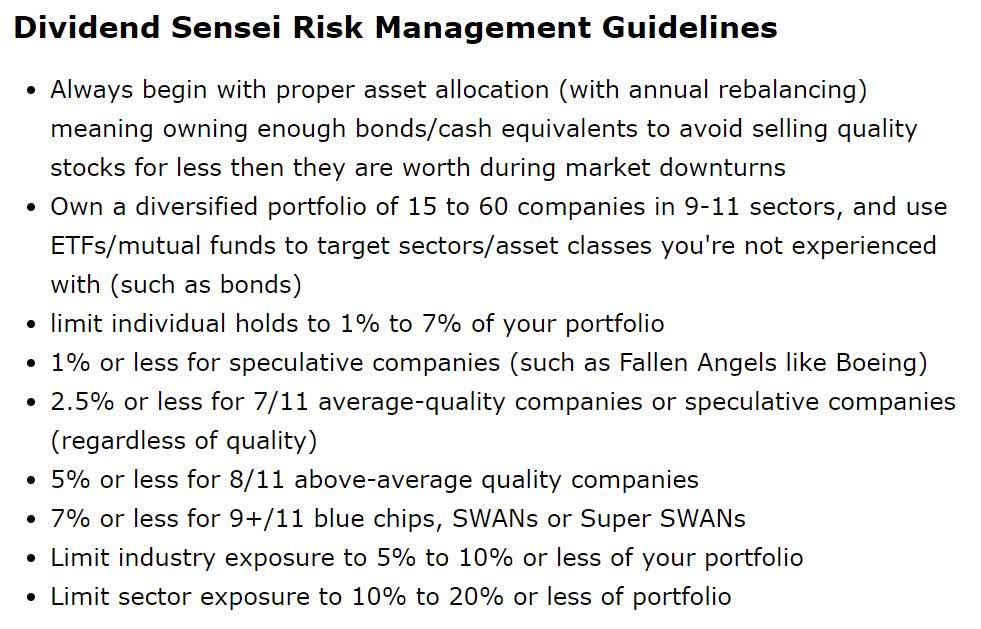
This is the risk-management framework that now guides my retirement portfolio where I keep 100% of my life savings.
It’s designed to ensure that no matter what happens with the economy or market in the next few years, I will not suffer a catastrophic permanent loss of capital.
The only way a diversified portfolio of blue-chip stocks and prudent allocation of bonds/cash (to prevent you from becoming a forced seller at the worst possible time) can lose money is by the following three ways:
- You panic sell during a market correction (the bonds/cash decrease volatility minimizing this risk)
- You face unexpected expenses that force you to sell stocks at irrationally low prices, realizing otherwise paper losses (bonds/cash + emergency fund is meant to minimize this risk)
- This is actually the end of the world and most businesses are going to zero (in which case no portfolio strategy would make a difference and we’ll be too dead to care about stock returns)
But here’s the second half of how I’m dealing with this unprecedented economic uncertainty (oil hit -$37 at one point on April 20th, proving we live in truly insane times).
I don’t try to time the market, going “all in at the bottom.”
Instead, I have a set schedule to put my discretionary savings (money I don’t need for 5+ years) to work on a reasonable and prudent schedule.
That schedule is designed to allow me to buy stocks every week forever (though most heavily through the end of August).
Right now, I’m buying 2 to 3 stocks every Friday, off the Dividend Kings Phoenix watchlist. I literally just follow along with the Phoenix portfolio, the companies most likely to rise from the ashes of this recession and soar to new heights.
I’m buying nothing but the highest quality blue chips, including plenty of dividend aristocrats, kings, Super SWANs, and companies that have an average credit rating of “A”.
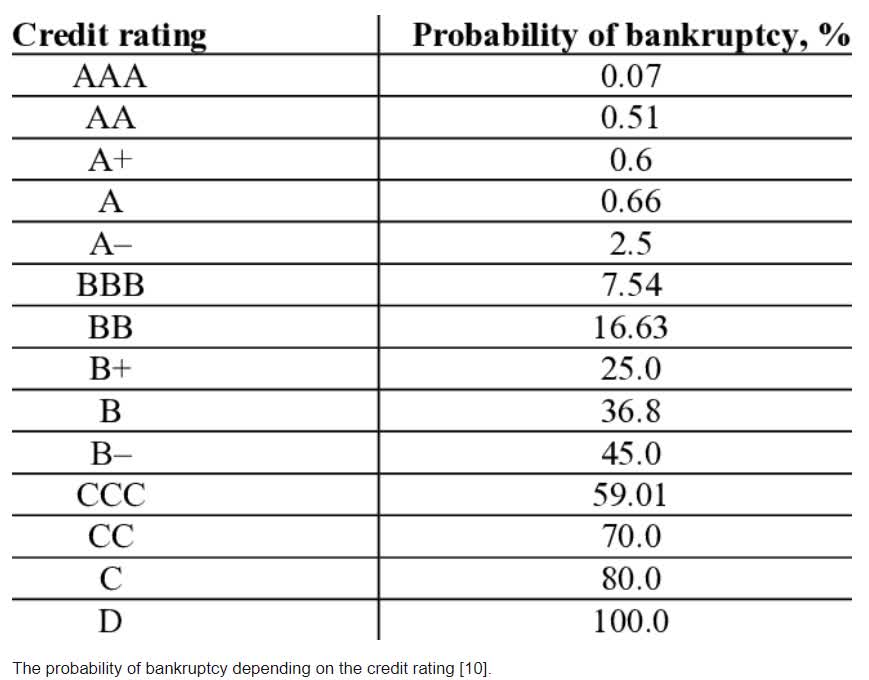
(Source: the University of St. Petersburg)
The probability of an A-rated company going bankrupt over the long-term (30 years) is about 0.7%.
That’s the probability of a single A-rated company going to zero, over 30 years (credit ratings are based on 30-year historical default statistics). What’s the probability of a diversified portfolio of A-rated companies going to zero?
| Holdings | Probability of Going to Zero | Probability (1 in X) |
| 1 | 0.66% | 151.5151515 |
| 5 | 0.00000000001% | 79850993192 |
| 10 | 0.000000000 | 6.37618E+21 |
| 15 | 0.000000000 | 5.09144E+32 |
| 20 | 0.000000000 | 4.06557E+43 |
| 25 | 0.000000000 | 3.2464E+54 |
| 50 | 0.000000000 | 1.05391E+109 |
| 100 | 0.000000000 | 1.11072E+218 |
My risk management guidelines say that you should own at least 15 companies (7% or less risk cap on 15 blue chips, in different industries and sectors).
The probability of 15 A-rated companies going bankrupt is 1 in 5.09*10^32 (5.1 billion, trillion, trillion).
The probability of an even more diversified portfolio going to zero, such as 100 stock portfolio of A-rated companies is 1 in 1.1*10^218.
There aren’t that many atoms in the universe, and the entire estimated lifetime of the Universe, from the big bang to heat death, is about 1* 10^100 years.
Does this mean that buying 100 companies with an average credit rating of “A” is 100% sure to not lose money? Nope.
The above table assumes each company’s bankruptcy risk is an independent event. In other words, company X goes bankrupt and it in no way effects company Y.
In reality, if an A-rated company goes bankrupt it means we’re likely facing economic conditions so severe that the probability of company Y and Z going under if company X does, is much higher than the standard 0.7% historical statistic.
This is the same reason that Black Monday, 1987 when the S&P 500 fell 20% in a single day happened. That was a 25 standard deviation event, theoretically not likely to occur over several lifetimes of the universe.
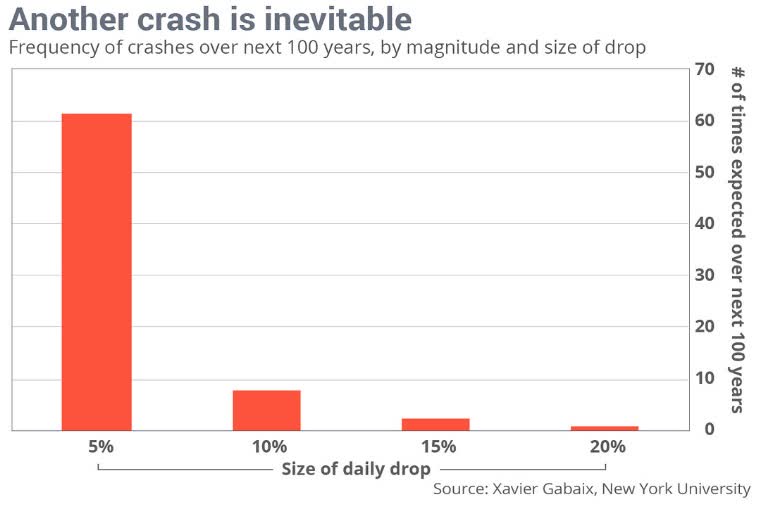
Actually, Harvard statisticians tell us that a 20% single-day crash is a once in 104-year event.
Finance is connected, as is the US and global economy. BUT the reason I am so confident in my 100% blue-chip focused approach is simple.
- Scenario A: this isn’t the end of the world: in which case stocks will recovery as they always have
- Scenario B: this is the economic apocalypse, in which case the global economy is likely to be obliterated and money itself will likely lose all value, in which case you’re investing strategy is meaningless
If you truly believe this is the end, and there is no future, then why are you even invested in the stock market?
Saving & Investing = putting of consumption today in order to be able to consume more tomorrow.
If there is no tomorrow, then there is no point in saving & investing.
(Source: imgflip)
I choose to be an optimist about the long-term, but always a realistic pragmatist in the short-term. Why? Because that’s the key to sound long-term investing and achieving your financial goals.
Want More Great Investing Ideas?
9 “BUY THE DIP” Growth Stocks for 2020
7 “Safe-Haven” Dividend Stocks for Turbulent Times
Investors Beware: It’s Still Really Bad Out There!
SPY shares were trading at $278.00 per share on Wednesday morning, up $4.96 (+1.82%). Year-to-date, SPY has declined -13.12%, versus a % rise in the benchmark S&P 500 index during the same period.
About the Author: Adam Galas

Adam has spent years as a writer for The Motley Fool, Simply Safe Dividends, Seeking Alpha, and Dividend Sensei. His goal is to help people learn how to harness the power of dividend growth investing. Learn more about Adam’s background, along with links to his most recent articles. More...
More Resources for the Stocks in this Article
| Ticker | POWR Rating | Industry Rank | Rank in Industry |
| SPY | Get Rating | Get Rating | Get Rating |