

SS&C Technologies (SSNC - Get Rating) is approaching a resistance level. If it surpasses this level a breakout could occur…
SSNC provides software products and software-enabled services to a variety of customers primarily in financial services but also healthcare firms. In addition, the company provides portfolio accounting, portfolio management, trading, banking/lending, and other software to asset managers, banks, and financial advisors.
The company is seeing success with its newest products and growing its client base. It was able to leverage algorithmic capabilities and the pandemic into its investment scenarios. On the health side, SSNC launched its flu pilot program, which provides outreach to SS&C Health clients to enhance the rates of flu vaccinations. The company also developed a similar COVAX program that ensured the successful completion of the COVID Vaccine.
SS&C has a healthy balance sheet with $1.8 billion in cash and only $78 million in short-term debt as of the last reported quarter. The firm’s net margin of 12.2% is higher than the industry average. In its most recent quarter, earnings were up 5% year over year, while revenue was flat.
The stock’s trailing P/E is elevated at 28.27, but its forward P/E is low at 14.73. The company has an overall grade of A, or a Strong Buy in our POWR Ratings, along with a Momentum Grade of A. Aside from a drop yesterday, the stock has been in an uptrend over the past ten days.
Take a look at the 1-year chart of SSNC below with the added notations:
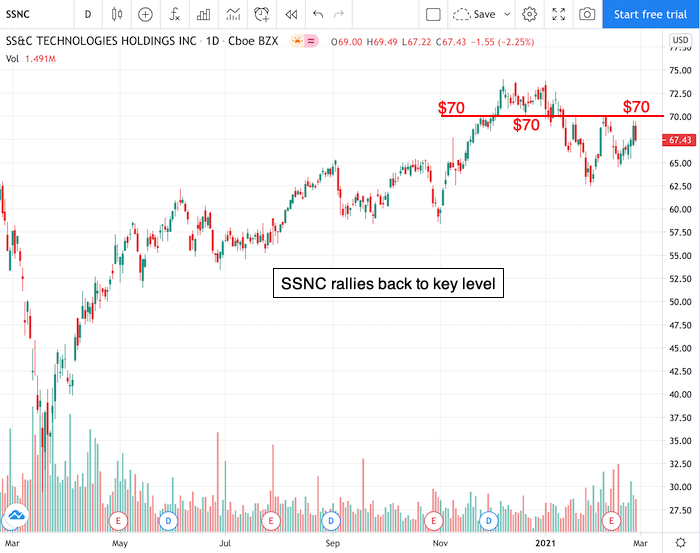
During the past few months, SSNC has formed a key level to watch at the $70 (red) mark, as that level has provided both support and resistance multiple times. SSNC is currently sitting just under that level now, and a rally higher could bring another $70 resistance test.
A trader could enter a long trade on a break back above the $70 mark.
Want to Discover More Great Trades?
I have explored virtually every flavor of technical analysis and chart pattern known to mankind. The sad fact is that the vast majority of them don’t work at all.
That is why I recently put together this special report to help investors focus on the only 5 chart patterns that matter…the ones that lead to the most timely and profitable stock trades. Click below to get your copy now!
5 WINNING Stock Chart Patterns
Have a good trading day!
Good luck!
Christian Tharp, CMT
SSNC shares were unchanged in premarket trading Friday. Year-to-date, SSNC has declined -7.31%, versus a 2.69% rise in the benchmark S&P 500 index during the same period.
About the Author: christian

Christian is an expert stock market coach at the Adam Mesh Trading Group who has mentored more than 4,000 traders and investors. He is a professional technical analyst that is a certified Chartered Market Technician (CMT), which is a designation awarded by the CMT Association. Christian is also the author of the daily online newsletter Todays Big Stock. More...
More Resources for the Stocks in this Article
| Ticker | POWR Rating | Industry Rank | Rank in Industry |
| SSNC | Get Rating | Get Rating | Get Rating |


