
SS&C Technologies Holdings Inc. (SSNC): Price and Financial Metrics
SSNC Price/Volume Stats
| Current price | $72.29 | 52-week high | $73.30 |
| Prev. close | $68.02 | 52-week low | $46.61 |
| Day low | $70.90 | Volume | 2,959,800 |
| Day high | $73.30 | Avg. volume | 967,171 |
| 50-day MA | $63.37 | Dividend yield | 1.42% |
| 200-day MA | $60.35 | Market Cap | 17.88B |
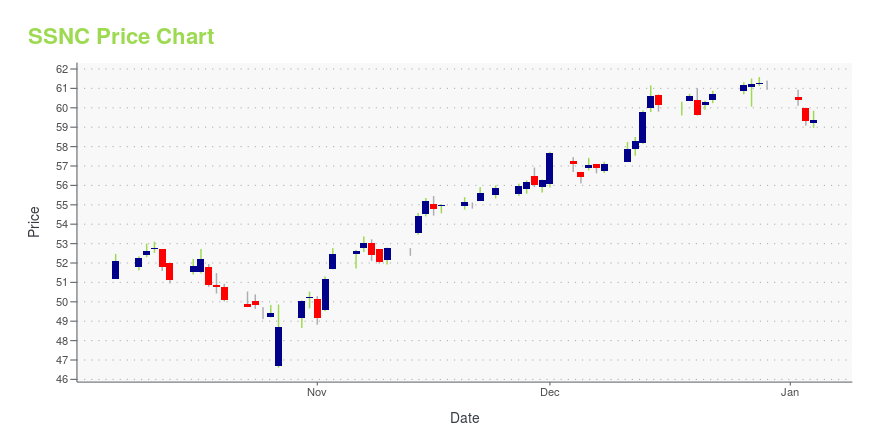
SSNC Stock Price Chart Interactive Chart >
SS&C Technologies Holdings Inc. (SSNC) Company Bio
SS&C Technologies Holdings, Inc. (known as SS&C) is an American multinational holding company headquartered in Windsor, Connecticut, that sells software and software as a service to the financial services industry. The company has offices in the Americas, Europe, Asia, Africa and Australia. (Source:Wikipedia)
Latest SSNC News From Around the Web
Below are the latest news stories about SS&C TECHNOLOGIES HOLDINGS INC that investors may wish to consider to help them evaluate SSNC as an investment opportunity.
SS&C GlobeOp Forward Redemption IndicatorSS&C Technologies Holdings, Inc. (Nasdaq: SSNC) today announced that the SS&C GlobeOp Forward Redemption Indicator for for December 2023 measured 3.64%, up from 3.49% in November. |
SS&C Technologies Holdings (SSNC) Delivered Inconsistent GrowthDiamond Hill Capital, an investment management company, released its “Long-Short Fund” third-quarter 2023 investor letter. A copy of the same can be downloaded here. The positive returns of the portfolio outperformed the Russell 1000 Index and the blended benchmark (60% Russell 1000 Index/40% Bloomberg US Treasury Bills 1-3 Month Index), both of which were negative in […] |
SS&C GlobeOp Hedge Fund Performance Index and Capital Movement IndexSS&C Technologies Holdings, Inc. (Nasdaq: SSNC) today announced the gross return of the SS&C GlobeOp Hedge Fund Performance Index November 2023 measured 1.99%. |
SS&C Technologies Holdings (NASDAQ:SSNC) shareholders have earned a 6.4% CAGR over the last five yearsWhen you buy and hold a stock for the long term, you definitely want it to provide a positive return. Better yet, you'd... |
SS&C ALPS Advisors Adds Fixed Income ETF to the LineupSS&C ALPS Advisors, a wholly-owned subsidiary of SS&C Technologies Holdings, Inc. (Nasdaq: SSNC), has partnered with Smith Capital Investors to launch the ALPS | Smith Core Plus Bond ETF (NYSE Arca: SMTH), an active, fixed income ETF. |
SSNC Price Returns
| 1-mo | 16.43% |
| 3-mo | 18.50% |
| 6-mo | 18.53% |
| 1-year | 19.55% |
| 3-year | 0.38% |
| 5-year | 26.69% |
| YTD | 19.21% |
| 2023 | 19.21% |
| 2022 | -35.65% |
| 2021 | 13.73% |
| 2020 | 19.51% |
| 2019 | 37.15% |
SSNC Dividends
| Ex-Dividend Date | Type | Payout Amount | Change | ||||||
|---|---|---|---|---|---|---|---|---|---|
| Loading, please wait... | |||||||||
Continue Researching SSNC
Here are a few links from around the web to help you further your research on SS&C Technologies Holdings Inc's stock as an investment opportunity:SS&C Technologies Holdings Inc (SSNC) Stock Price | Nasdaq
SS&C Technologies Holdings Inc (SSNC) Stock Quote, History and News - Yahoo Finance
SS&C Technologies Holdings Inc (SSNC) Stock Price and Basic Information | MarketWatch
Loading social stream, please wait...