
A key level of support has formed in the chart of TAL Education Group (TAL). If this level is broken, a breakdown is expected.
TAL Education Group operates as a holding company, which through its subsidiaries, engages in the provision of after-school tutoring programs for primary and secondary school students. Its services are delivered through small classes; personalized premium services, such as one-on-one tutoring; and online course offerings for primary and middle school students.
Take a look at the 1-year chart of TAL (TAL - Get Rating) below with added notations:
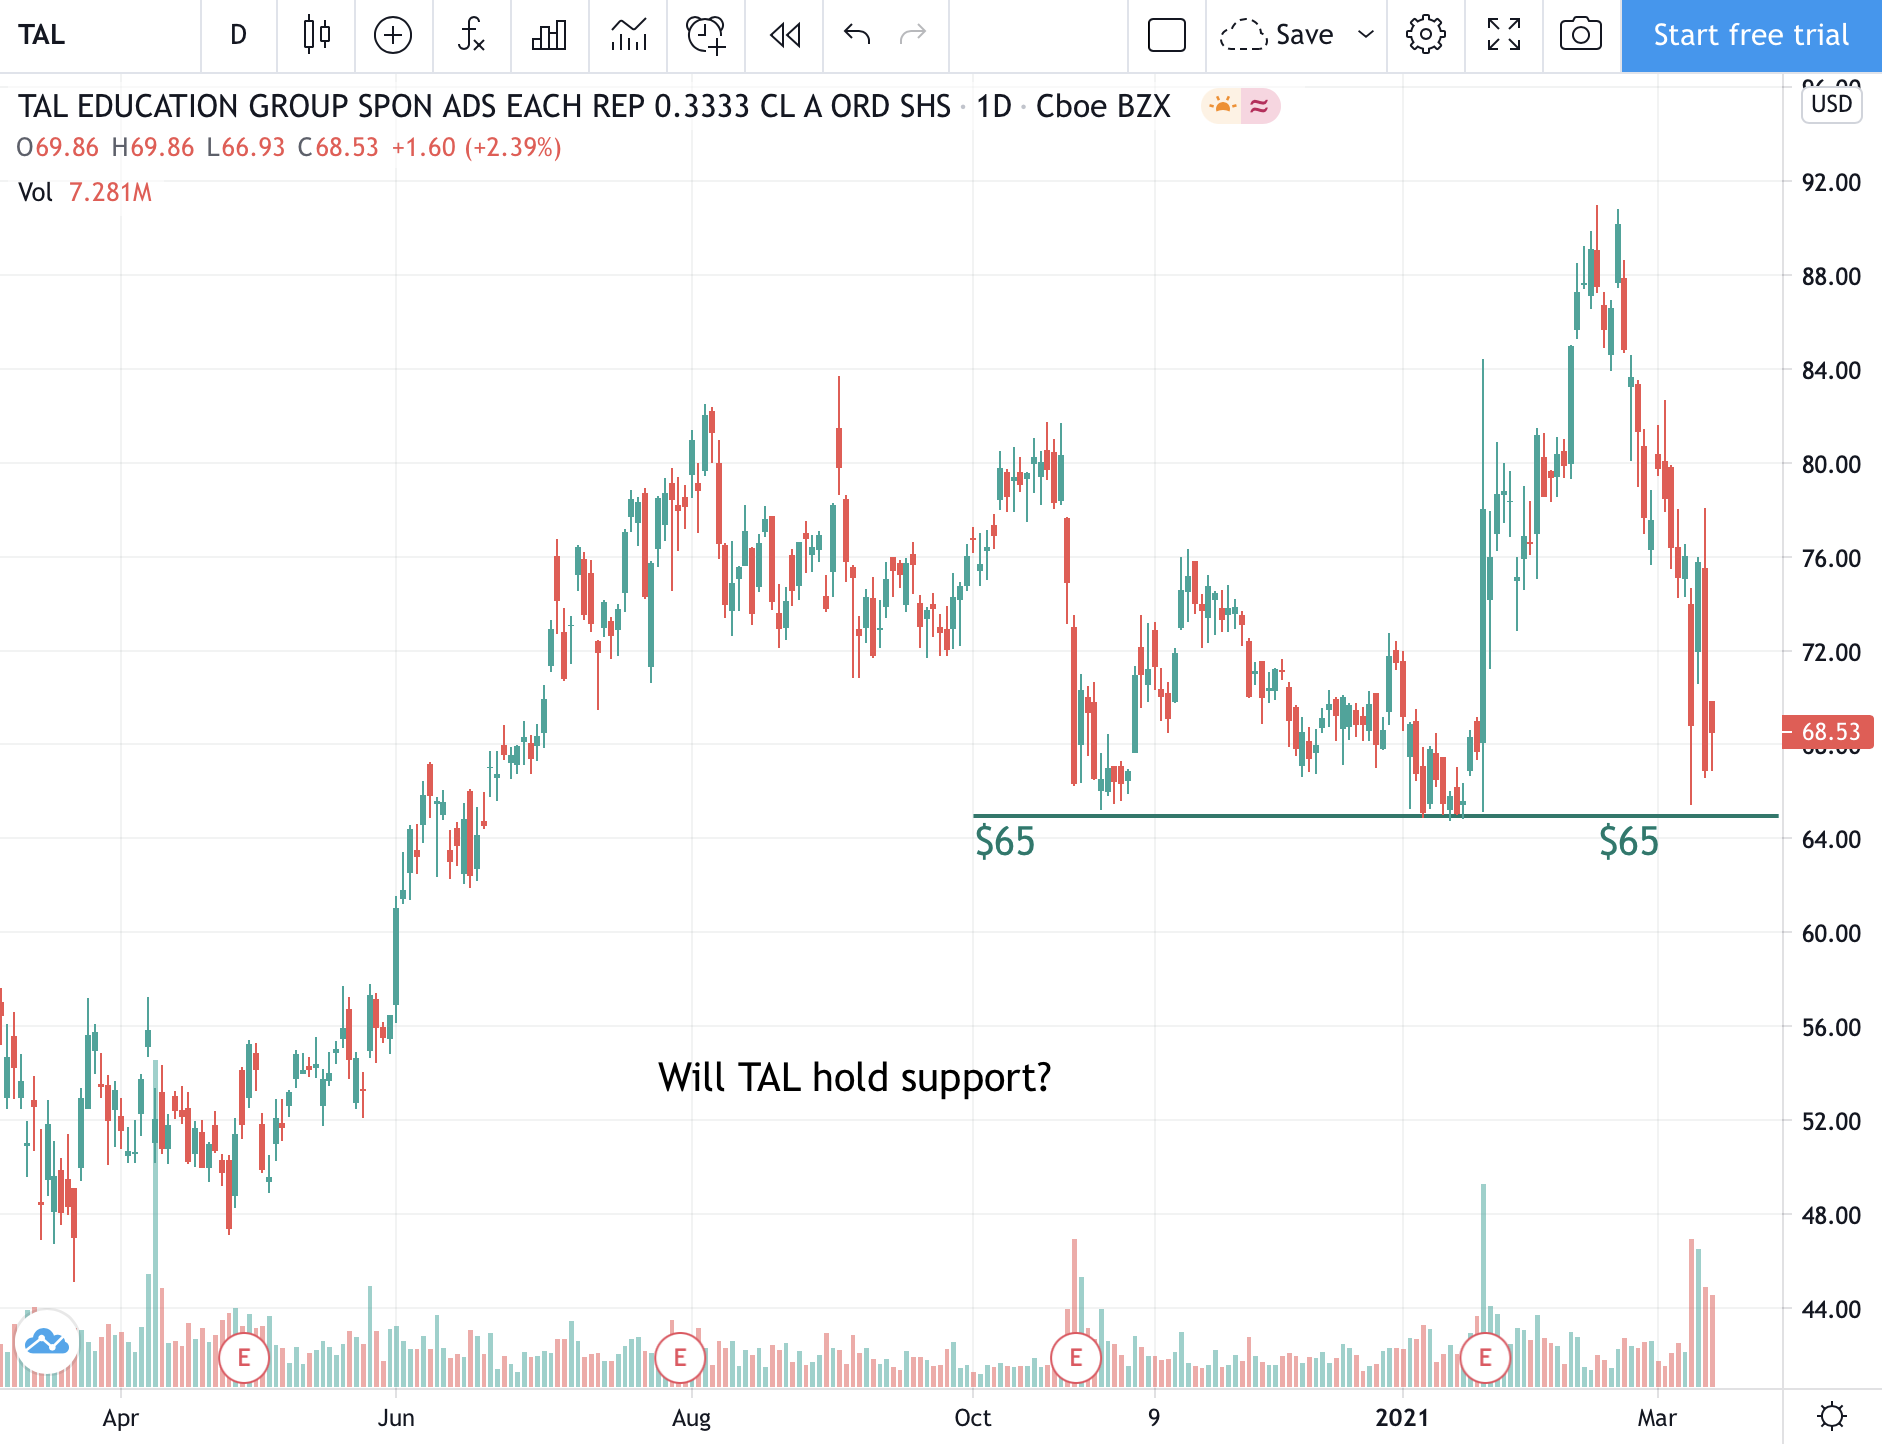
TAL has created a key level of support at the $65 (green) level over the past several months. The stock is making its way back down to that level again and if the support were to break, lower prices will likely follow.
Therefore, if the stock were to break below the support level, a short position could be entered.
Want to Discover More Great Trades?
I have explored virtually every flavor of technical analysis and chart pattern known to mankind. The sad fact is that the vast majority of them don’t work at all.
That is why I recently put together this special report to help investors focus on the only 5 chart patterns that matter…the ones that lead to the most timely and profitable stock trades. Click below to get your copy now!
5 WINNING Stock Chart Patterns
Have a good trading day!
Good luck!
Christian Tharp, CMT
TAL shares fell $1.03 (-1.50%) in premarket trading Friday. Year-to-date, TAL has declined -5.61%, versus a 4.79% rise in the benchmark S&P 500 index during the same period.
About the Author: Christian Tharp

I am an expert stock market coach having helped over 4000 beginner and advanced traders & investors from around the world take control of their financial futures. I also write stock market related articles for the Adam Mesh Trading Group and Yolo Publishing. More...
More Resources for the Stocks in this Article
| Ticker | POWR Rating | Industry Rank | Rank in Industry |
| TAL | Get Rating | Get Rating | Get Rating |


