

Triumph Group Inc. (TGI - Get Rating) designs and manufactures a broad portfolio of aerostructures, aircraft components, and systems for the aviation industry. It serves a worldwide customer base of players in the commercial, business, and military markets.
Although the company took a hit during the pandemic, the long-term outlook for the commercial aerospace industry is bullish due to the air travel demand. In fact, the company is seeing sales growth from Airbus commercial programs. Plus, TGI has a strong presence in the U.S. defense market.
The company had $237 million in cash as of the most recent quarter compared with only $5 million in short-term debt. However, TGI has a negative profit margin. Sales have been down an average of 18.3% over the past three years and down 33.5% over the last year.
But analysts expect earnings to rise 2,133.3% for the year, which has led to a Growth Grade of B in our POWR Ratings service. The stock appears overvalued at its current price with a forward P/E of 37.59. TGI’s stock is down for the month, but up 55.7% for the year. It has been in a long-term uptrend since November as seen in the chart below.
Take a look at the 1-year chart of TGI below with the added notations:
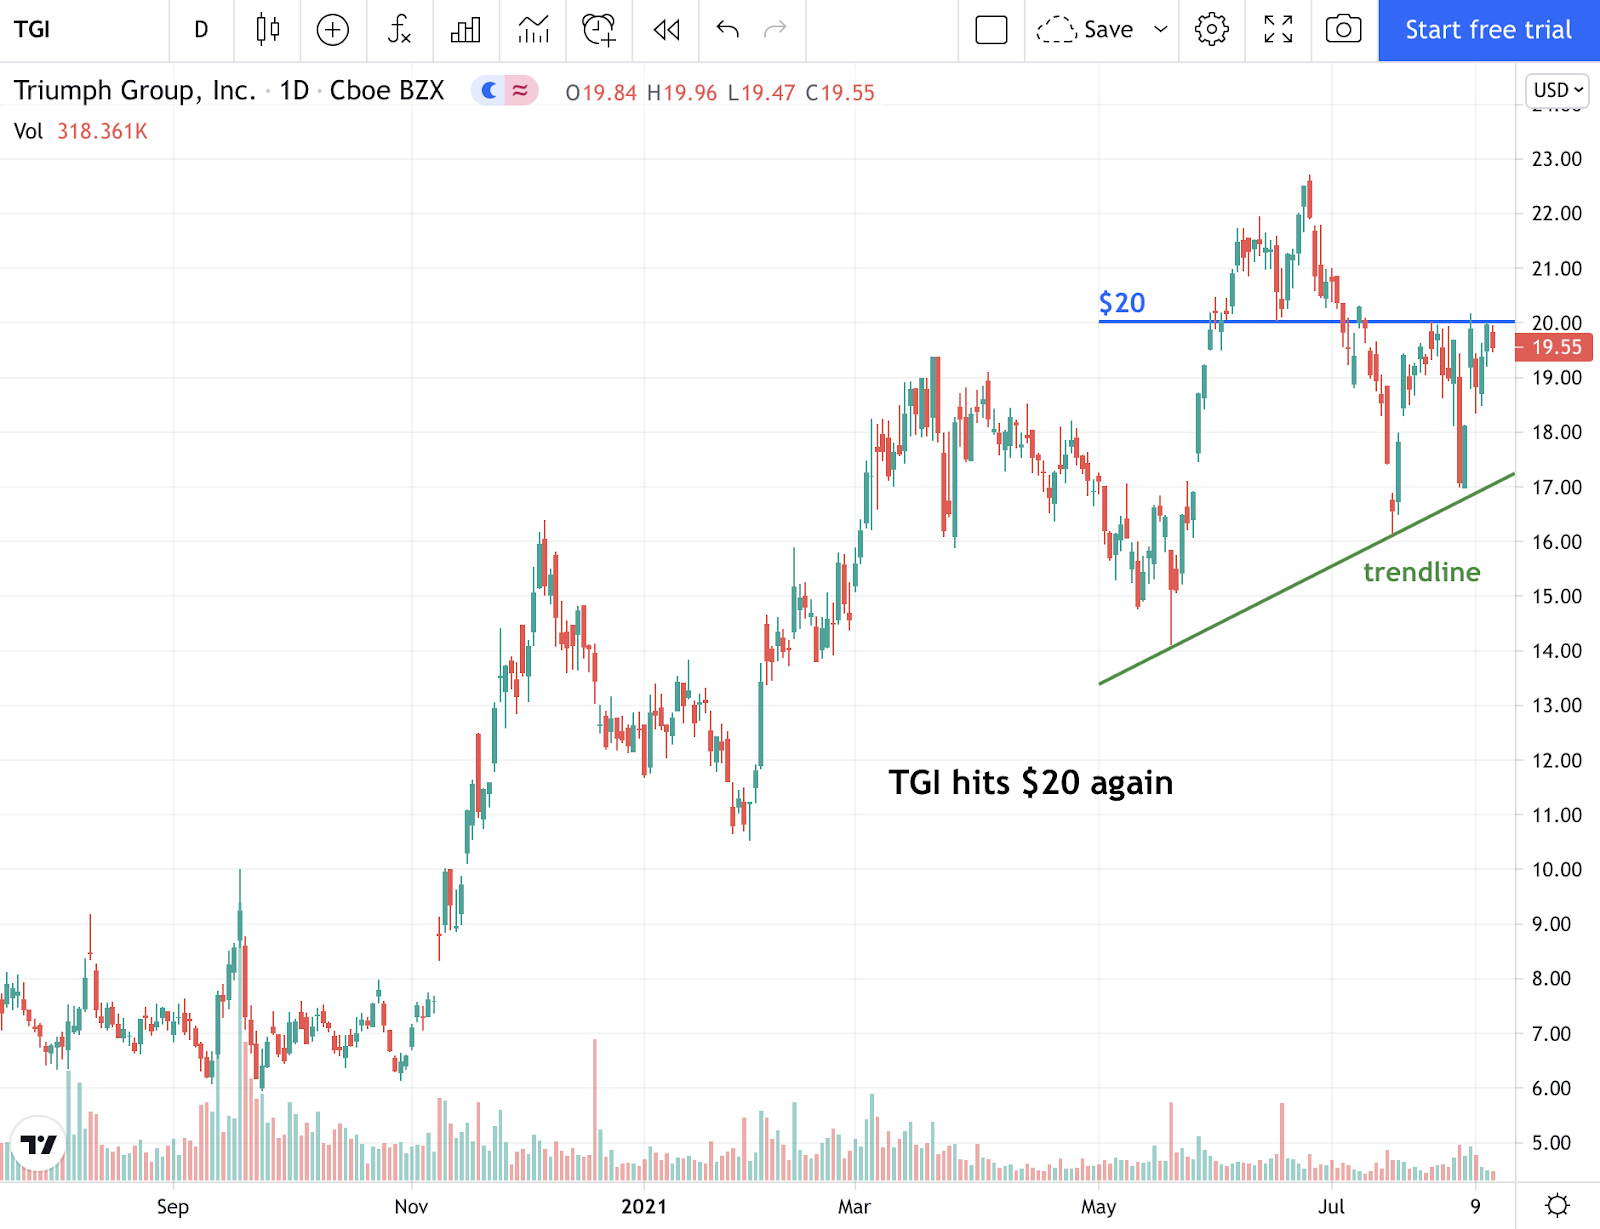
An ascending triangle pattern has formed in the chart of TGI. After falling below a previous $20 support mark back in July, TGI has rallied back up to hit that same $20 level as resistance multiple times. Along the way, the stock has also formed a trendline of support.
Click Here to Read the Greatest Trading Book Ever Written
Eventually, one of those two lines will break. A long trade could be entered on a break above $20 with a stop placed under the point of entry. However, if support were to break, lower prices could follow instead.
Want to Discover More Great Trades?
I have explored virtually every flavor of technical analysis and chart pattern known to mankind. The sad fact is that the vast majority of them don’t work at all.
That is why I recently put together this special report to help investors focus on the only 5 chart patterns that matter…the ones that lead to the most timely and profitable stock trades. Click below to get your copy now!
5 WINNING Stock Chart Patterns
Have a good trading day!
Good luck!
Christian Tharp, CMT
Want More Great Investing Ideas?
TGI shares were trading at $19.66 per share on Friday morning, up $0.11 (+0.56%). Year-to-date, TGI has gained 56.53%, versus a 19.91% rise in the benchmark S&P 500 index during the same period.
About the Author: Christian Tharp

I am an expert stock market coach having helped over 4000 beginner and advanced traders & investors from around the world take control of their financial futures. I also write stock market related articles for the Adam Mesh Trading Group and Yolo Publishing. More...
More Resources for the Stocks in this Article
| Ticker | POWR Rating | Industry Rank | Rank in Industry |
| TGI | Get Rating | Get Rating | Get Rating |


