Triumph Group, Inc. (TGI): Price and Financial Metrics

Triumph Group, Inc. (TGI): $7.52

0.29 (-3.71%)

POWR Rating

Component Grades

Momentum

B

Stability

D

Sentiment

Quality

C

Add TGI to Watchlist
Sign Up

Industry: Air/Defense Services

Industry

C

Ranked

#50 of 71

in industry

TGI Price/Volume Stats
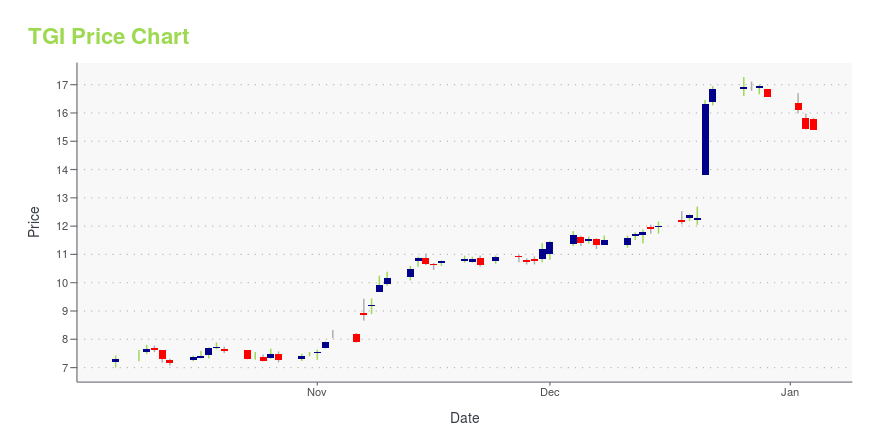
Current price $7.52 52-week high $13.33
Prev. close $7.81 52-week low $7.39
Day low $7.39 Volume 1,567,800
Day high $7.85 Avg. volume 1,115,048
50-day MA $9.62 Dividend yield N/A
200-day MA $10.93 Market Cap 576.88M

TGI Stock Price Chart Interactive Chart >

TGI POWR Grades

  • Value is the dimension where TGI ranks best; there it ranks ahead of 85.41% of US stocks.
  • TGI's strongest trending metric is Growth; it's been moving down over the last 179 days.
  • TGI ranks lowest in Sentiment; there it ranks in the 3rd percentile.

TGI Stock Summary

  • TRIUMPH GROUP INC's capital turnover -- a measure of revenue relative to shareholder's equity -- is better than just 4.77% of US listed stocks.
  • Equity multiplier, or assets relative to shareholders' equity, comes in at -2.22 for TRIUMPH GROUP INC; that's greater than it is for just 4.72% of US stocks.
  • In terms of twelve month growth in earnings before interest and taxes, TRIUMPH GROUP INC is reporting a growth rate of 107.56%; that's higher than 88.74% of US stocks.
  • If you're looking for stocks that are quantitatively similar to TRIUMPH GROUP INC, a group of peers worth examining would be PRTH, SEAS, SIX, BGS, and FREE.
  • TGI's SEC filings can be seen here. And to visit TRIUMPH GROUP INC's official web site, go to www.triumphgroup.com.

TGI Valuation Summary

  • TGI's price/earnings ratio is 8.2; this is 55.91% lower than that of the median Industrials stock.
  • TGI's price/sales ratio has moved down 0.4 over the prior 243 months.

Below are key valuation metrics over time for TGI.

Stock Date P/S P/B P/E EV/EBIT
TGI 2023-09-15 0.5 -0.9 8.2 9.5
TGI 2023-09-14 0.5 -0.9 8.2 9.5
TGI 2023-09-13 0.5 -0.9 8.1 9.4
TGI 2023-09-12 0.5 -0.9 8.2 9.5
TGI 2023-09-11 0.5 -0.9 8.0 9.4
TGI 2023-09-08 0.5 -0.9 8.2 9.5

TGI Growth Metrics

    The year over year revenue growth rate now stands at -21.92%.
  • Its 3 year net income to common stockholders growth rate is now at 86.71%.
  • Its 2 year revenue growth rate is now at -49.66%.
Over the past 34 months, TGI's revenue has gone down $1,527,627,000.

The table below shows TGI's growth in key financial areas (numbers in millions of US dollars).

Date Revenue Operating Cash Flow Net Income to Common Stock
2022-12-31 1,372.49 -79.326 96.561
2022-09-30 1,362.884 -63.866 92.847
2022-06-30 1,412.68 -80.532 -22.749
2022-03-31 1,459.942 -137.016 -42.758
2021-12-31 1,540.124 -147.229 -105.702
2021-09-30 1,646.869 -118.922 -181.056

TGI's Quality Factors

The “Quality” component of the POWR Ratings focuses on 31 different factors of a companies fundamentals and operational strength. Here are some key insights as we drill into the specifics of these quality attributes.
  • TGI has a Quality Grade of C, ranking ahead of 28.14% of graded US stocks.
  • TGI's asset turnover comes in at 0.764 -- ranking 7th of 21 Aircraft stocks.
  • SIF, UAVS, and AIRI are the stocks whose asset turnover ratios are most correlated with TGI.

The table below shows TGI's key quality metrics over time.

Period Asset Turnover Gross Margin ROIC
2021-06-30 0.764 0.223 -0.011
2021-03-31 0.775 0.210 -0.107
2020-12-31 0.823 0.202 -0.117
2020-09-30 0.913 0.209 -0.108
2020-06-30 1.002 0.205 -0.083
2020-03-31 1.037 0.204 0.044

TGI Price Target

For more insight on analysts targets of TGI, see our TGI price target page. And for a list of of all stocks sorted by upside potential based on analyst target price, see our Top Price Target page.

Average Price Target $21.44 Average Broker Recommendation 1.78 (Moderate Buy)

Triumph Group, Inc. (TGI) Company Bio


Triumph Group designs, engineers, manufactures, repairs and overhauls a broad portfolio of aerostructures, aircraft components, accessories, subassemblies and systems. The company was founded in 1979 and is based in Hamilton, Bermuda.


TGI Latest News Stream


Event/Time News Detail
Loading, please wait...

TGI Latest Social Stream


Loading social stream, please wait...

View Full TGI Social Stream

Latest TGI News From Around the Web

Below are the latest news stories about TRIUMPH GROUP INC that investors may wish to consider to help them evaluate TGI as an investment opportunity.

REMINDER: TRIUMPH TO HOST INVESTOR DAY ON SEPTEMBER 13, 2023

Triumph Group, Inc. ("TRIUMPH" or the "Company") (NYSE:TGI) will host its Investor Day on Wednesday, September 13, 2023. Presentations by the TRIUMPH's management team will begin at 8:30 a.m. Eastern Time and the event will showcase TRIUMPH's key products and business leaders who will provide valuable insights into their operating strategies and plans to accelerate the future at TRIUMPH.

Yahoo | September 11, 2023

Top Defense Stocks for Q3 2023

Defense stocks’ fortunes are closely related to factors such as government defense spending, geopolitical risks and conflicts, and new technological advancements in warfare. Therefore, it comes as little surprise that increased levels of military expenditure, Russia’s invasion of Ukraine, and ongoing tensions in the South China Sea generally bode well for defense stocks.

Yahoo | September 1, 2023

Why Is Triumph Group (TGI) Up 3% Since Last Earnings Report?

Triumph Group (TGI) reported earnings 30 days ago. What's next for the stock? We take a look at earnings estimates for some clues.

Yahoo | September 1, 2023

Embraer (ERJ) Q2 Earnings Surpass Estimates, Revenues Rise Y/Y

Embraer's (ERJ) second-quarter revenues improve 26.8% year over year. The reported figure beats the Zacks Consensus Estimate by 11.2%.

Yahoo | August 16, 2023

TRIUMPH TO HOST INVESTOR DAY ON SEPTEMBER 13, 2023

Triumph Group, Inc. ("TRIUMPH" or the "Company") (NYSE:TGI) announced today that it will host an Investor Day on Wednesday, September 13, 2023, at Convene at One Liberty Plaza in New York, NY.

Yahoo | August 16, 2023

Read More 'TGI' Stories Here

TGI Price Returns

1-mo -17.27%
3-mo -38.81%
6-mo -33.92%
1-year -15.22%
3-year 9.78%
5-year -66.11%
YTD -28.52%
2022 -43.23%
2021 47.53%
2020 -50.19%
2019 121.29%
2018 -57.40%

Continue Researching TGI

Want to see what other sources are saying about Triumph Group Inc's financials and stock price? Try the links below:

Triumph Group Inc (TGI) Stock Price | Nasdaq
Triumph Group Inc (TGI) Stock Quote, History and News - Yahoo Finance
Triumph Group Inc (TGI) Stock Price and Basic Information | MarketWatch

Get Free Updates

Join thousands of investors who get the latest news, insights and top rated picks from StockNews.com!