
- The long-term chart is bullish going into the peak season for demand
- The daily trend is above neutral territory, but it continues to point higher- Cold temperatures provide support
- The amount of natural gas in storage is near a record high- The election could be a critical element in the battle between supply and demand
The battle between supply and demand in the natural gas futures arena as we move into the peak season for requirements is setting up to be a steel cage deathmatch. We are coming up on the start of the withdrawal season, where natural gas inventories begin to decline. Typically, the beginning of the winter season is a time of the year when natural gas prices move higher. The uncertainty of the weather and the demand for heating peaks at the end of each year.
Meanwhile, stockpiles of natural gas are well-above last year’s peak and are heading for a record high. Technically, natural gas has been on a bullish tear since late September. The trend turned higher in late June after the energy commodity traded to its lowest price since 1995 at $1.432 per MMBtu. As of the end of last week, the price of the nearby December futures contract was over twice the price as in late June and above $3.35 per MMBtu. However, inventories are at a level that will satisfy all requirements over the winter months even if it turns out to be colder than average season, and demand moves appreciably higher.
Fundamentals and technicals appear at odds as we move into the peak season for the natural gas market. We could be seeing price strength because of the November 3 election in the United States. Fracking for natural gas has been a debated issue. President Trump has been an advocate of the process that extracts natural gas from the earth’s crust. Many Democrats oppose fracking. Even though former Vice President Joe Biden recently said he would not ban fracking, the message has been inconsistent. Less fracking would lead to declining supplies of the energy commodity.
The United States Natural Gas Fund (UNG) moves higher and lower with the price of NYMEX natural gas futures. The BOIL and KOLD products provide leverage on the up and downside for the energy commodity.
The long-term chart is bullish going into the peak season for demand
Natural gas made a significant low in late June 2020 when the price reached $1.432 per MMBtu, a quarter-of-a-century low.
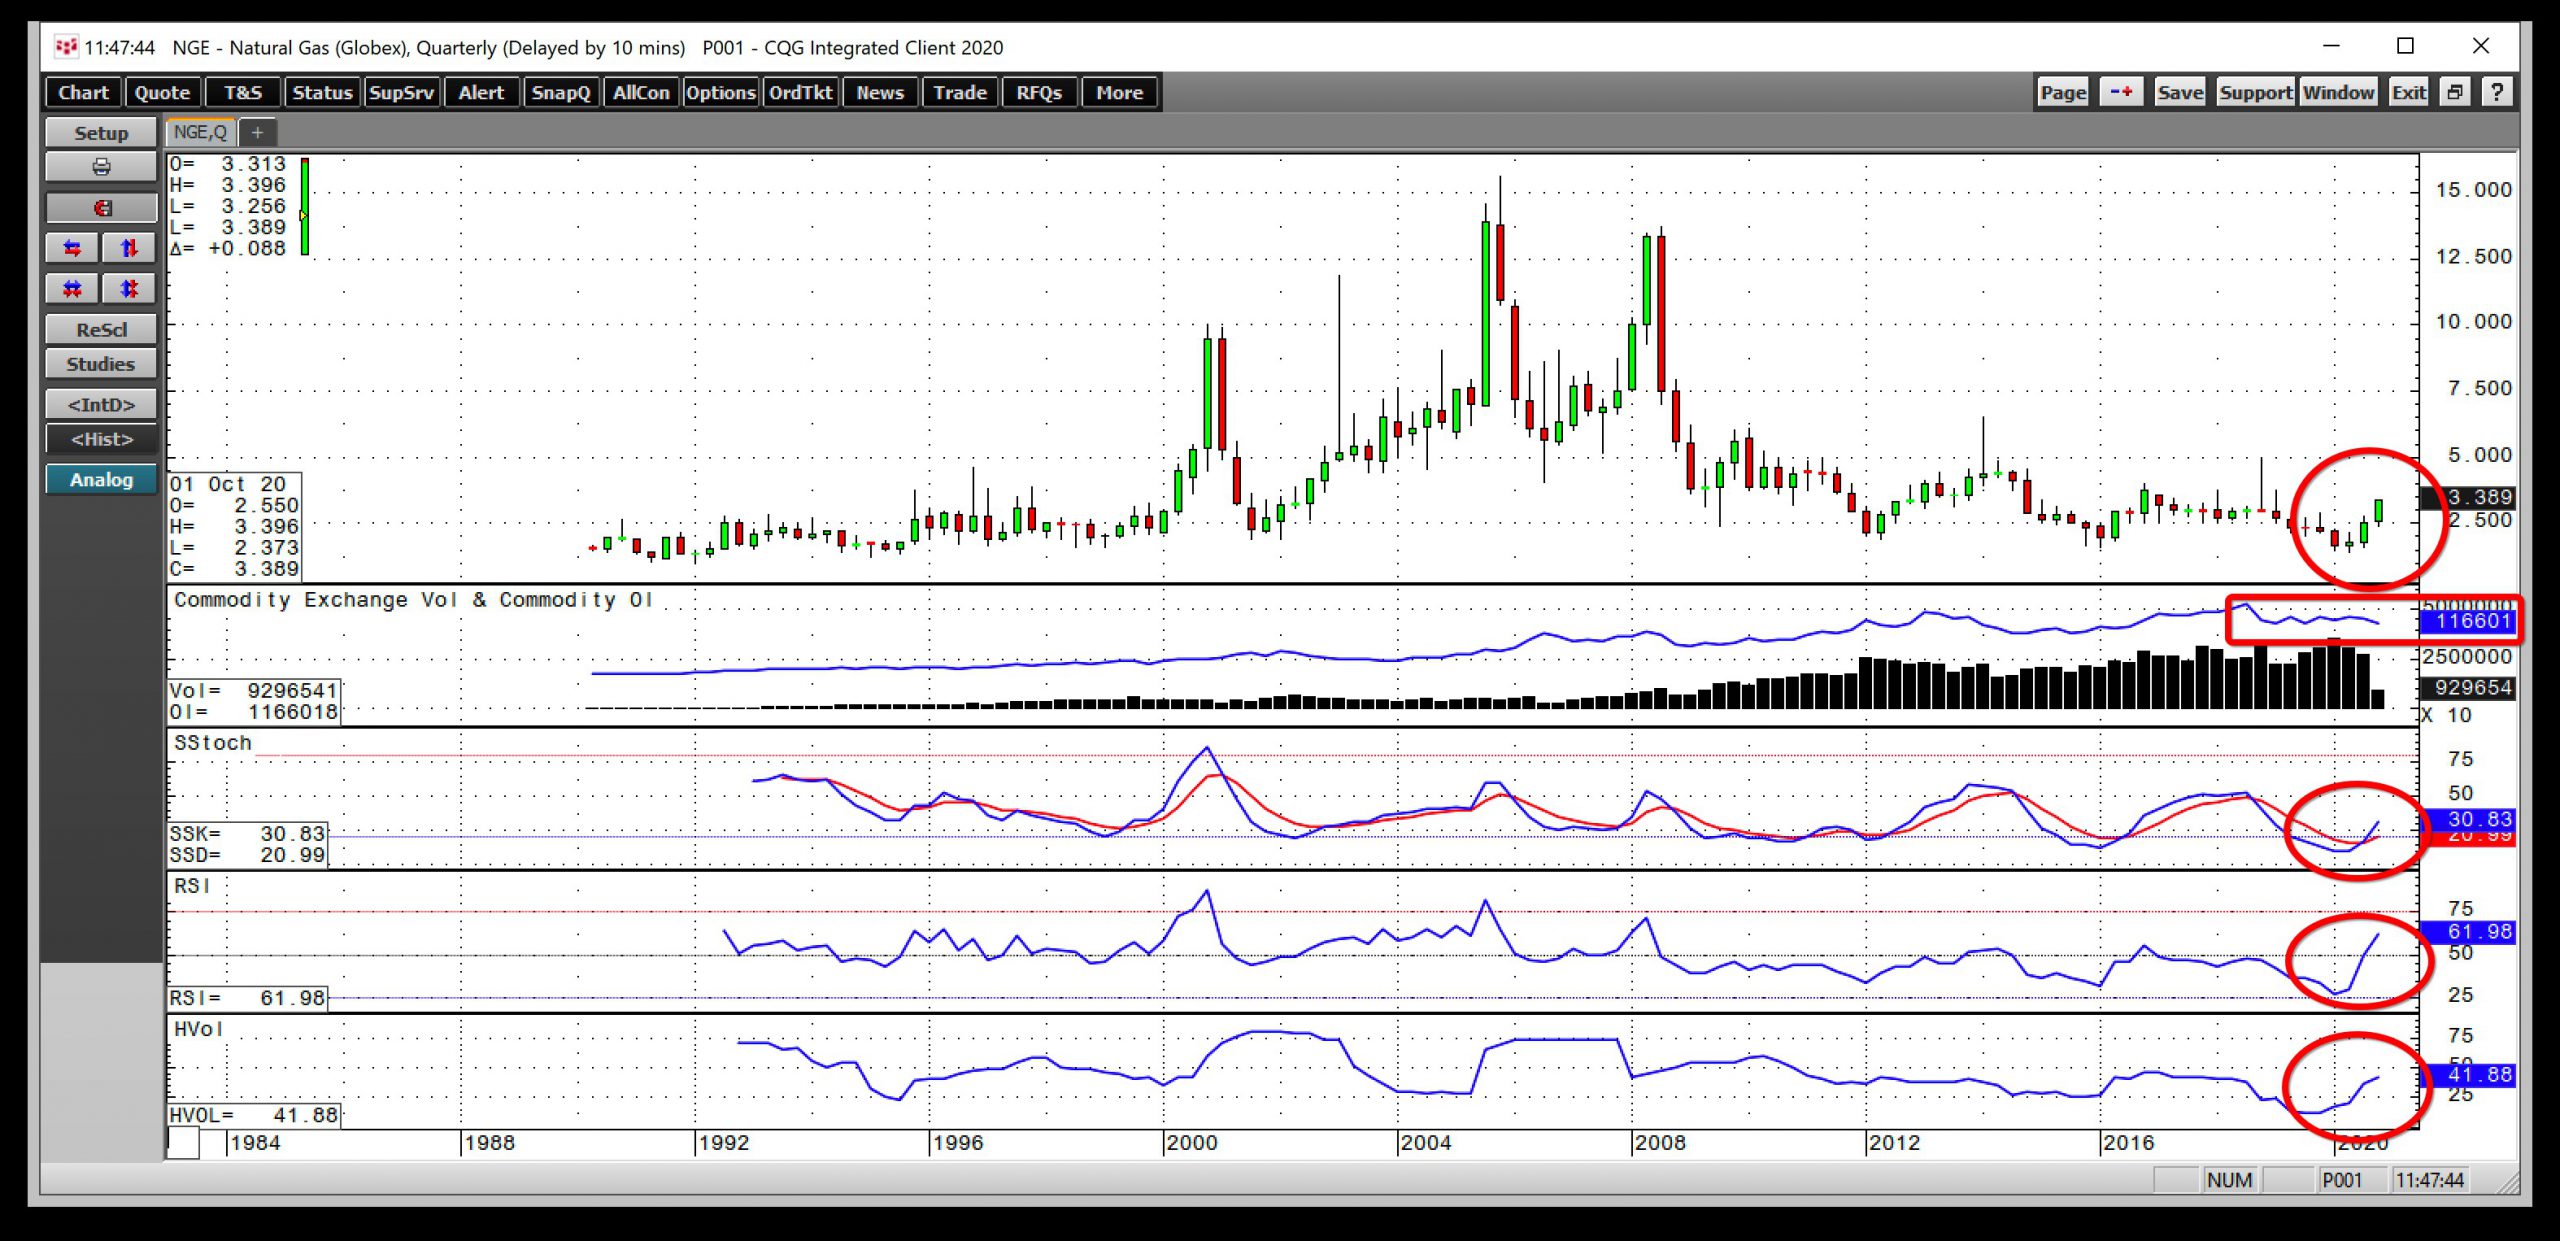
Source: CQG
The quarterly chart shows that the natural gas futures market is heading into the winter months of 2020/2021 with a head of bullish steam. The price posted gains over the past two consecutive quarters. A close above $2.789 per MMBtu at the end of December would mark the third quarter of gains.
Quarterly price momentum crossed higher from an oversold condition in July and was rising, albeit still well below neutral territory. The relative strength index was above a neutral reading at the end of last week on the long-term chart. Quarterly historical volatility at almost 42% was near the highest level of 2020, reflecting the widening quarterly trading ranges in the energy commodity.
While these technical indicators point to a bullish trend, the total number of open long and short positions in the natural gas futures market at 1.166 million contracts has been declining. Falling open interest and rising price is not typically a technical validation of a bullish trend in a futures market. Open interest is around 27,000 contracts below the level at the same time in 2019.
The daily trend is above neutral territory, but it continues to point higher- Cold temperatures provide support
The newly active month December NYMEX futures contract was trading at over the $3.35 per MMBtu level at the end of last week. The price is far higher than the peak last year as the energy commodity headed into the winter season. In November 2019, natural gas futures rose to a high of only $2.905 per MMBtu.
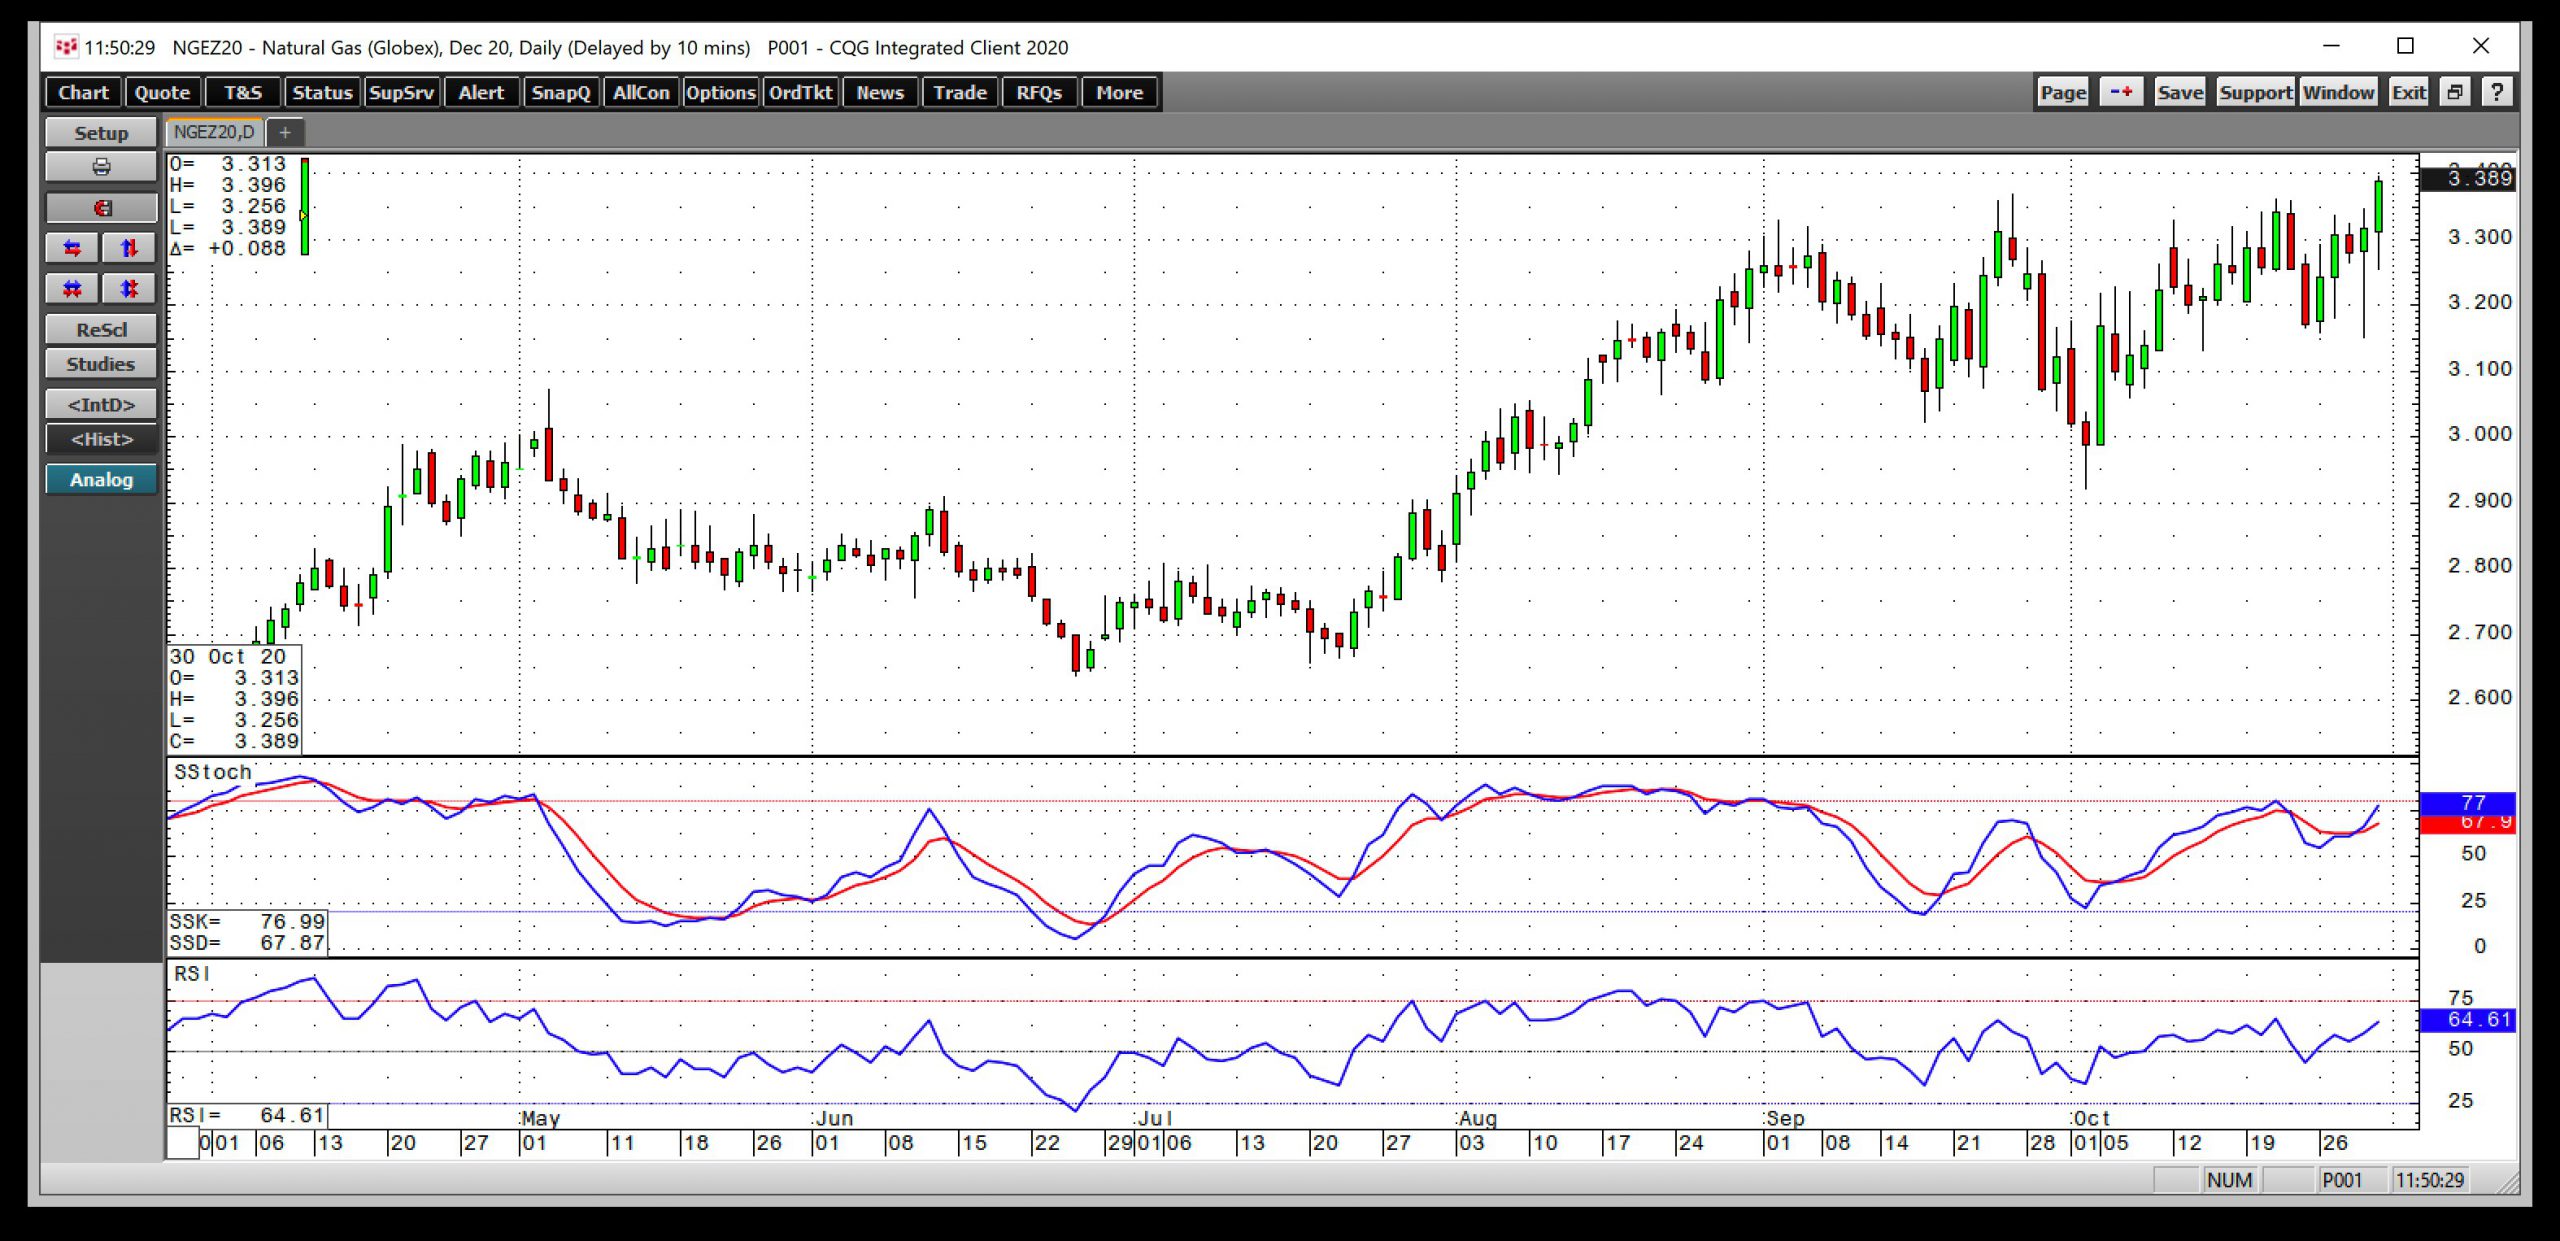
Source: CQG
While the nearby futures contract traded to a low of $1.432 in late June, seasonality in the natural gas futures market made the low for December delivery appreciably high at $2.637 per MMBtu. The daily chart illustrates the bullish trend of higher lows and higher highs. The most recent peak came on the final trading session of October at $3.396. Price momentum and relative strength indicators were above neutral readings and pointing higher as of October 30.
The recent wave of storms threatening natural gas infrastructure along the Gulf of Mexico and cold weather conditions in the United States in late October has been supporting the price of the energy commodity and pushing futures prices higher.
The amount of natural gas in storage is near a record high- The election could be a critical element in the battle between supply and demand
Two significant factors could determine the path of least resistance for natural gas prices over the coming days and weeks. We will find out if the price action from June will continue to take the energy commodity to higher highs or if they will run out of steam on the upside at a level that is already higher than the peak from the 2019/2020 winter season.
On Tuesday, the US election will determine the path of energy policy in the United States for the coming years. Limiting or banning fracking would cause production to decline and prices to rise. A continuation of the status quo and a frack-baby-frack policy would likely weigh on the price of the energy commodity over the coming years.
A victory by Democrats that captures both the White House and the Senate could be bullish for the natural gas price, while a win by President Trump and a Republican majority in the Senate would likely keep a lid on prices. The election could have a substantial impact on natural gas prices over the coming years.
In the short-term, there is plenty of natural gas available to meet all requirements over the coming winter months. The latest inventory report from the Energy Information Administration said that 3.955 bcf in storage as of the week ending on October 23. Historically there should be around three weeks to go before the first withdrawal from stockpiles. However, many consensus estimates pointed to a withdrawal for the week ending on October 30. An early decline in stocks would only validate the recent bullish price trend.
Technical indicators continue to support higher natural gas prices. However, the high level of stockpiles is saying, not so fast. Meanwhile, next week’s election could turn out to be the most significant factor for the energy commodity.
Want More Great Investing Ideas?
Why is the Stock Market Tanking Now?
7 Best ETFs for the NEXT Bull Market
5 WINNING Stocks Chart Patterns
UNG shares fell $0.03 (-0.26%) in after-hours trading Tuesday. Year-to-date, UNG has declined -31.14%, versus a 5.90% rise in the benchmark S&P 500 index during the same period.
About the Author: Andrew Hecht

Andy spent nearly 35 years on Wall Street and is a sought-after commodity and futures trader, an options expert and analyst. In addition to working with StockNews, he is a top ranked author on Seeking Alpha. Learn more about Andy’s background, along with links to his most recent articles. More...
More Resources for the Stocks in this Article
| Ticker | POWR Rating | Industry Rank | Rank in Industry |
| UNG | Get Rating | Get Rating | Get Rating |
| BOIL | Get Rating | Get Rating | Get Rating |
| KOLD | Get Rating | Get Rating | Get Rating |