

- The trend is always your friend in all markets as it reflects herd behavior
- The slow stochastic is a price momentum indicator
- The relative strength index points to overbought or oversold conditions
The natural gas futures market and related ETF and ETN products are highly volatile. Producers extract natural gas from the earth’s crust in its combustible form. The price action tends to be explosive and implosive. Since June 2020, we have seen the price rally by over 137%. Since October 30, the energy commodity corrected by over 25% at its most recent low of $2.525 per MMBtu on November 19.
The volatility in the natural gas market makes it dangerous and exciting at the same time. High levels of price variance are a nightmare for investors, but it creates a paradise of opportunities for traders who flock to the market because of its broad percentage moves.
Fundamentalists follow production, consumption, and inventory data to analyze past, present, and future price directions. Technical analysts follow trends or the herd behavior that drives a price to the up or downside.
When I first sat down at a trading desk four decades ago, my boss and mentor told me that the only thing to remember about markets is prices go higher when there are more buyers than sellers, and lower when selling is greater than buying. Following that advice involves a chart and a few simple technical tools.
The United States Natural Gas Fund (UNG - Get Rating) moves higher and lower with NYMEX natural gas futures contracts.
The trend is always your friend in all markets as it reflects herd behavior
In 2006, James Surowiecki published his book, The Wisdom of Crowds. Surowiecki outlines various case studies that prove large groups are smarter and make better decisions than the elite few, no matter how brilliant.
Groups do a better job solving problems, fostering innovation, making wise decisions, and predicting the future. The markets across all asset classes are the embodiment of Surowiecki’s work, and a bullish or bearish trend reflects the herd mentality of the wisdom of the crowd.
Over the past four decades, markets consistently remind me that the trend is always your best friend. Identifying areas where the trend bends or reverses is the goal of technical analysis. Two tools, the slow stochastic and the relative strength indicator, can be highly useful.
Natural gas is a very volatile market, attracting a wide audience of market participants looking to profit from substantial percentage moves created by price trends. When those trends end, the price action often experiences a fast and furious reversal of fortunes.
The slow stochastic is a price momentum indicator
Stochastic oscillators quantify the momentum of a price rise or decline. They work by comparing closing prices with price ranges over a time period. The theory behind these tools is that prices tend to close near the highs in rising markets and near the lows in falling ones. A reading below 20 indicates an oversold condition, while a reading over 80 points to an overbought condition.
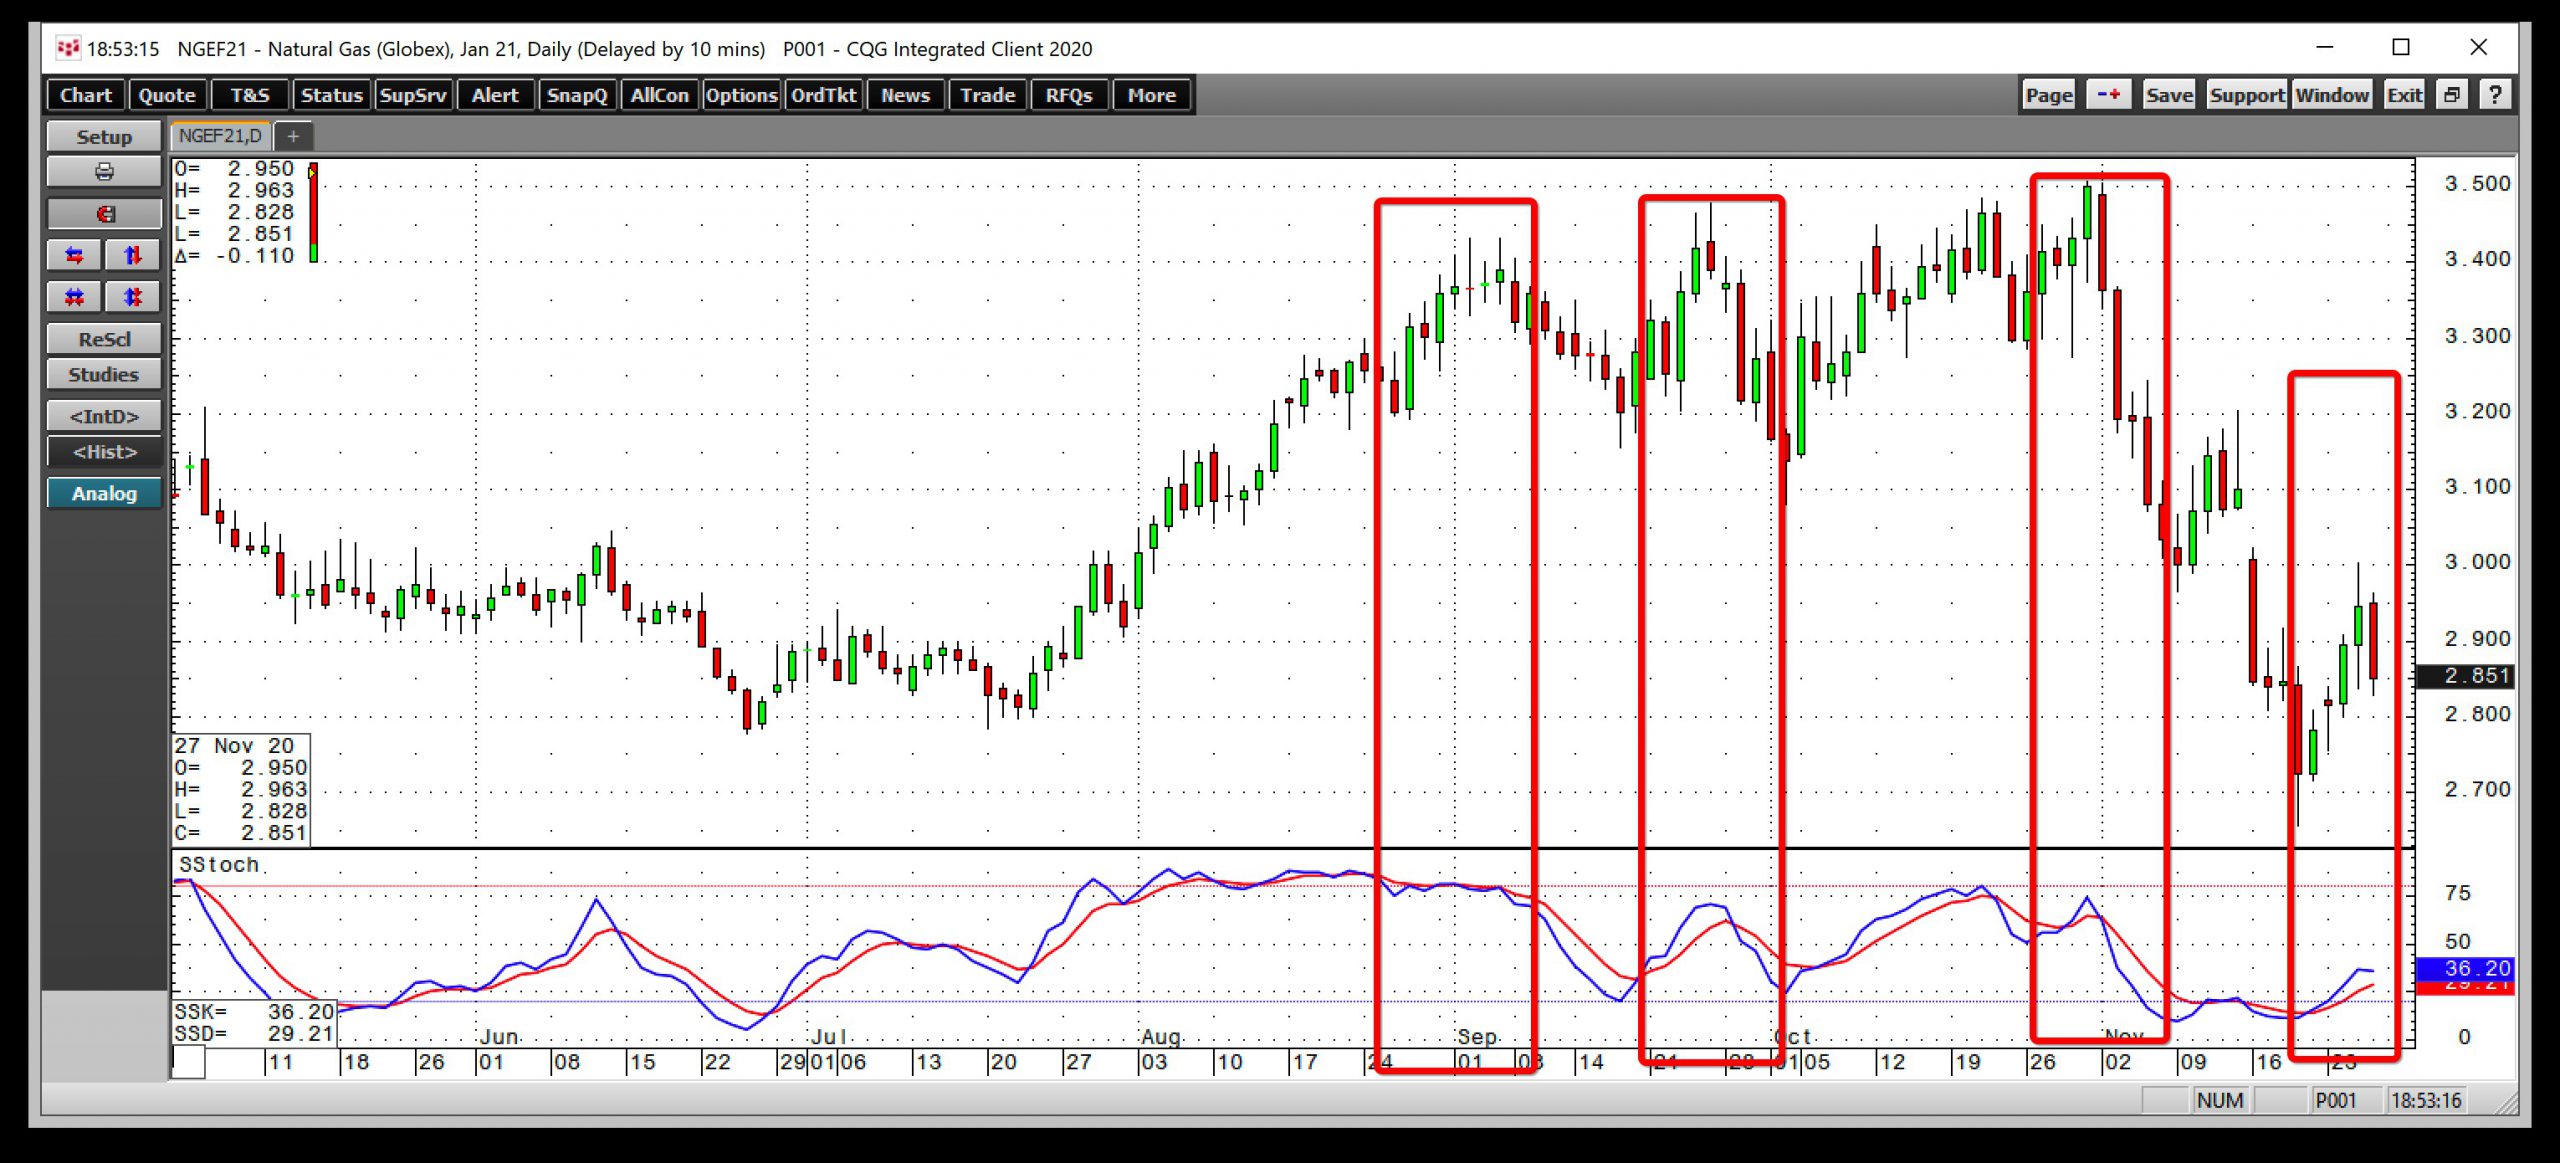 Source: CQG
The chart shows that January natural gas futures rose to overbought territory in early September when the price reversed. The metric fell to an oversold reading in the middle of the month. In October, an oversold reading gave way to a rally and pushed the metric back to overbought territory in late October when it crossed lower, and the price fell. Last week, the slow stochastic was crossing higher at an oversold reading, and the price was moving back to the upside.
The slow stochastic can be an excellent tool to confirm the validity of price trends.
The relative strength index points to overbought or oversold conditions
The relative strength indicator compared recent gains and losses in a market to determine if a price trend is in overbought or oversold territory. The RSI measures range from 0-100. A reading below 30 indicates an oversold condition, while over 70 points to an overbought reading.
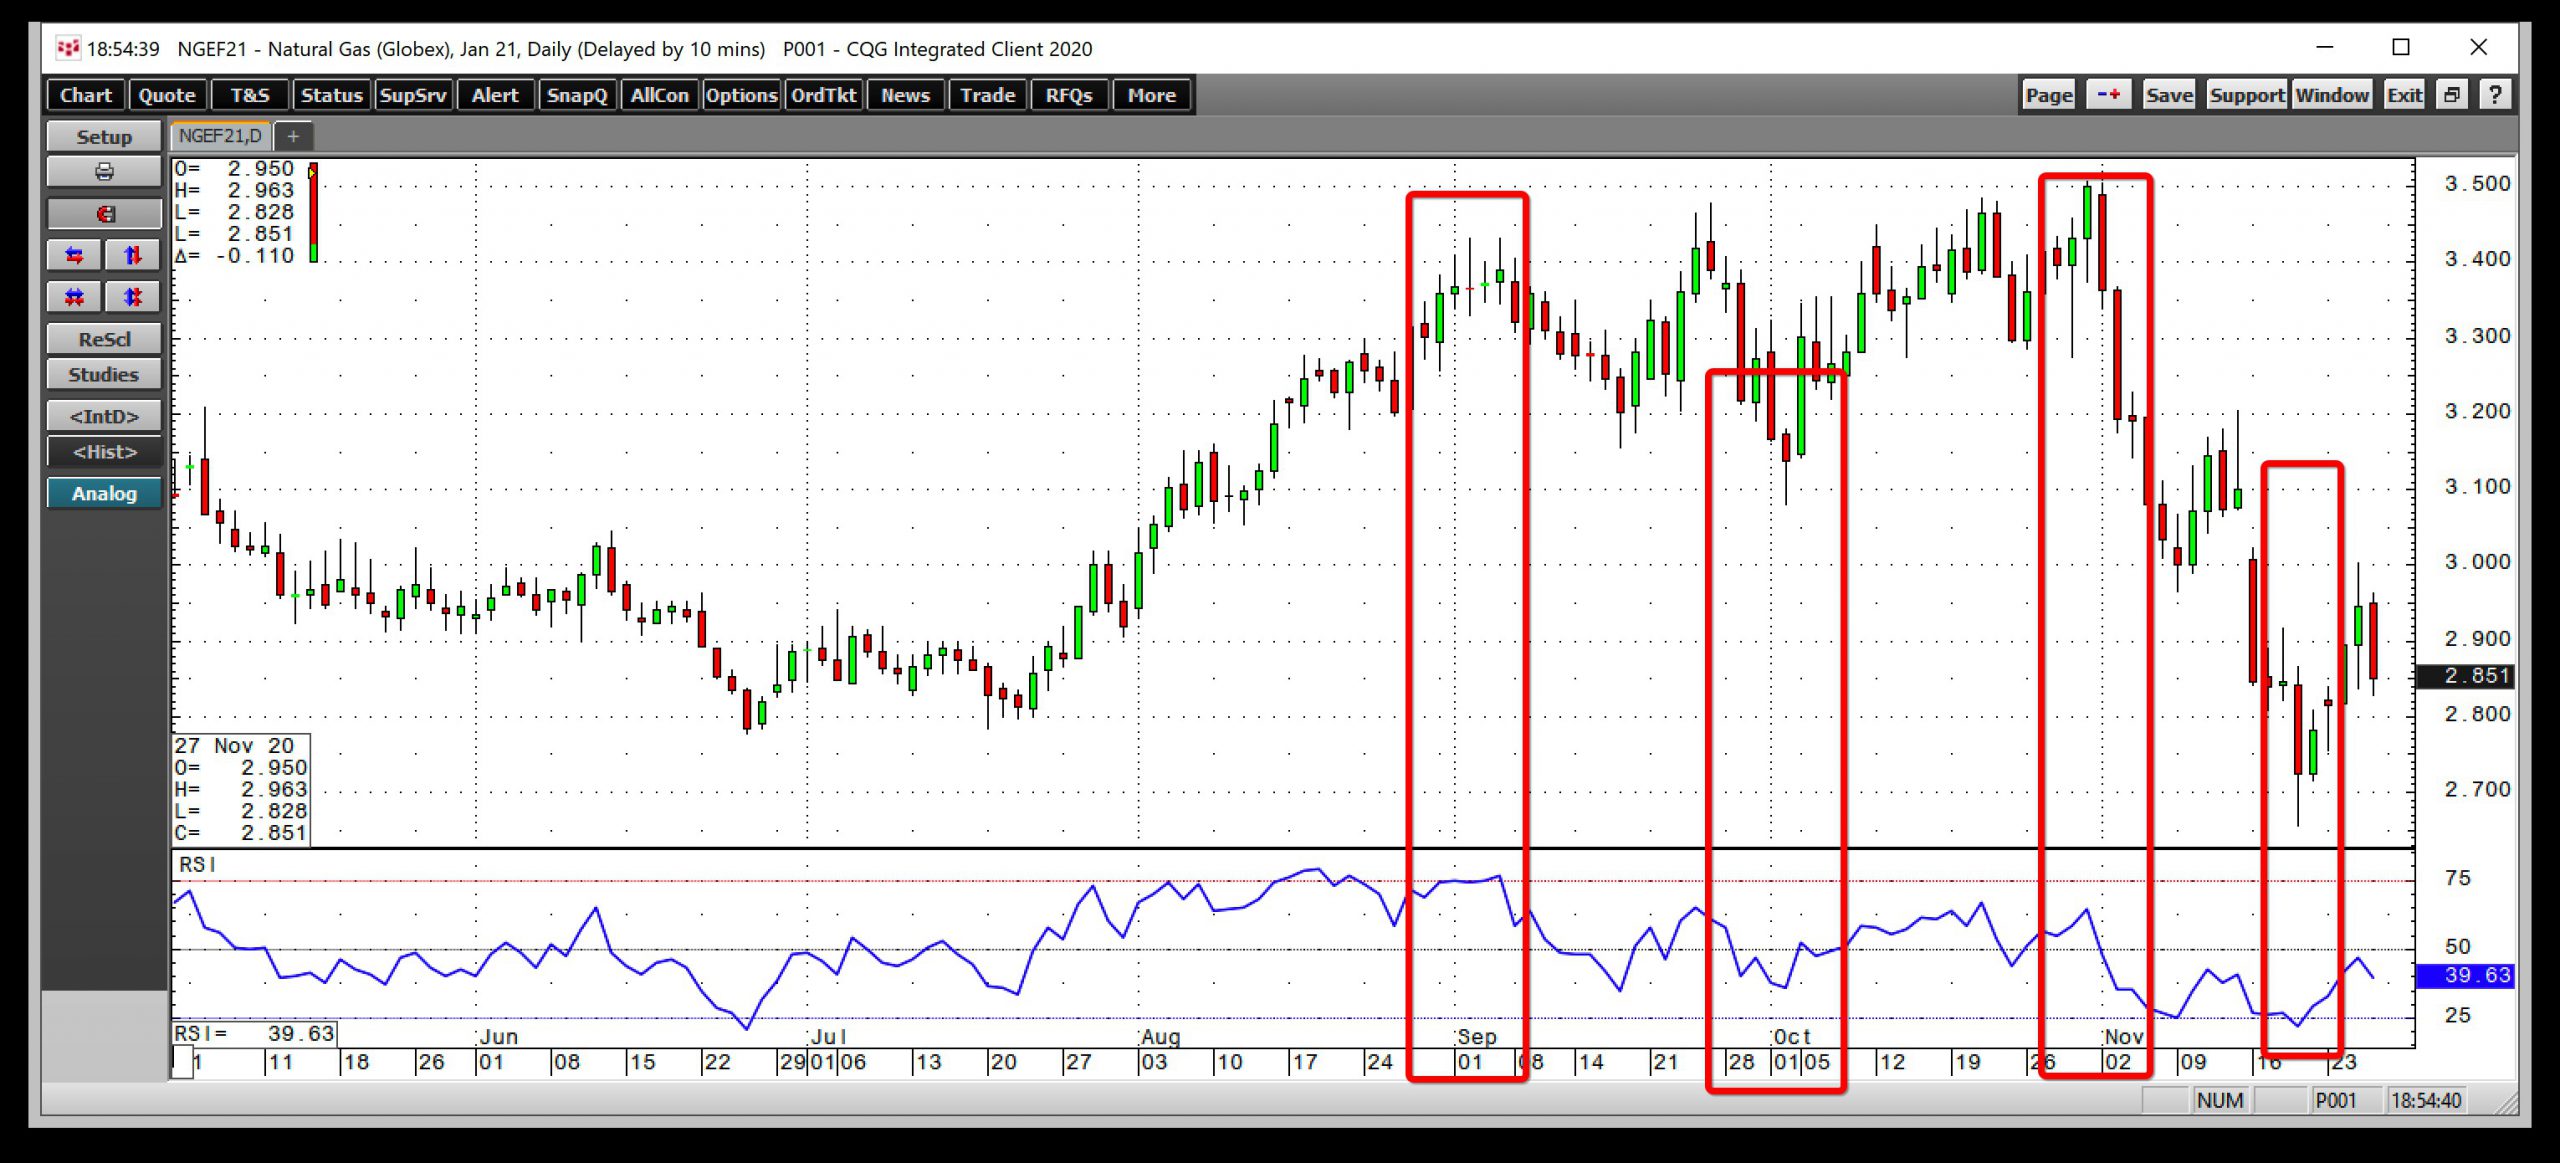 Source: CQG
The chart highlights the validity of the relative strength metric from early September through last week. On November 19, when January futures reached a low of $2.656 per MMBtu, the relative strength index was in oversold territory with a reading at 22.07.
The slow stochastic and relative strength indicators are far from perfect tools, as markets often remain at overbought or oversold conditions for extended periods. However, both metrics can be useful for traders and investors looking for higher-odds entry or exit levels in markets.
Natural gas is one of the most volatile markets, but the short and medium-term price trends offer the potential for trading profits. The metrics help identify when the price action runs out of steam on the up or downside. Late last week, both the stochastic and RSI were at readings that suggest the price trend has turned higher after the November 19 low in the energy commodity. We should keep a close eye on the selling on November 27 as natural gas fell by 11.8 cents on the final session of the week. However, the low level of volume last Friday is not a technical validation of the bearish price action.
Want More Great Investing Ideas?
9 “MUST OWN” Growth Stocks for 2021
Investors: We Have Much to Be Thankful For! (Market outlook and trading strategy from Steve Reitmeister)
5 WINNING Stocks Chart Patterns
UNG shares were trading at $10.80 per share on Monday morning, up $0.53 (+5.16%). Year-to-date, UNG has declined -35.94%, versus a 14.12% rise in the benchmark S&P 500 index during the same period.
About the Author: Andrew Hecht

Andy spent nearly 35 years on Wall Street and is a sought-after commodity and futures trader, an options expert and analyst. In addition to working with StockNews, he is a top ranked author on Seeking Alpha. Learn more about Andy’s background, along with links to his most recent articles. More...
More Resources for the Stocks in this Article
| Ticker | POWR Rating | Industry Rank | Rank in Industry |
| UNG | Get Rating | Get Rating | Get Rating |


