

- The market expected a 50 bcf injection into storage
- Steaming towards the record high at 4.047 tcf
- Natural gas steady on the back of another hurricane heading for the Gulf of Mexico
Last week, the Energy Information Administration told us that natural gas inventories rose to 3.756 trillion cubic feet for the week ending on September 25. The level of natural gas in storage across the United States surpassed last year’s peak at 3.732 tcf.
At the end of the 2019 injection season, stockpiles were at a high historical level, which led to pressure on the price of natural gas futures that trade on the NYMEX division of the CME. In November 2019, when uncertainty about the weather conditions during the peak season for natural gas demand rose, the price only made it to a high of $2.905 per MMBtu. By late June, the nearby futures contract fell to a low of $1.432 per MMBtu, the lowest level since 1995.
On Thursday, October 8, the EIA reported inventory data for the week ending on October 2. Each injection over the coming weeks will only push the amount of the energy commodity higher as the winter season approaches. We could see the stockpiles rise to a record high before the beginning of the 2020/2021 withdrawal season in November.
The United States Natural Gas Fund (UNG - Get Rating) moves higher and lower with the futures that trade on NYMEX.
The market expected a 50 bcf injection into storage
According to Estimize, a crowdsourcing website, the consensus estimate for the injection into natural gas storage across the US for the week ending on October 2 was around 50 billion cubic feet.
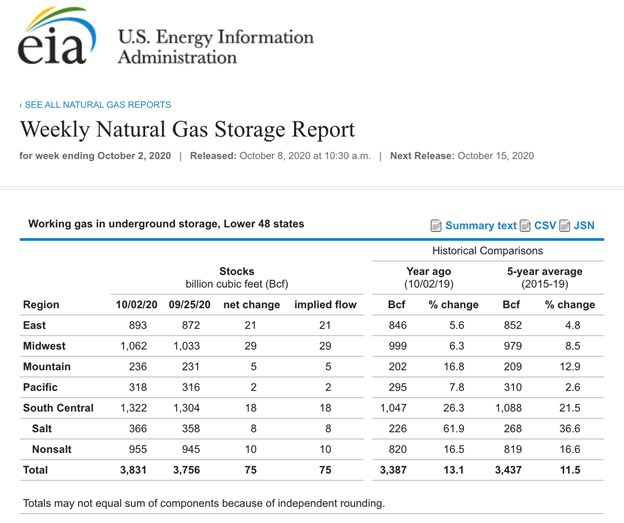
Source: EIA
As the chart shows, the EIA reported inventories rose by a more than expected 75 billion cubic feet, pushing the total amount of natural gas in storage to 3.831 trillion cubic feet. Stockpiles stand at 13.1% above last year’s level and 11.5% over the five-year average for early October. Even though it was the twenty-seventh consecutive week where the percentage above last year declined, stockpiles are at an extremely high level going into the 2020/2021 peak season for demand that begins in November.
Steaming towards the record high at 4.047 tcf
Since the EIA began reporting natural gas inventory levels, the record high for natural gas inventories was 4.047 tcf. With approximately six weeks to go in the injection season, an average build of 37 bcf would take the amount in storage to a new record high.
There will be plenty of natural gas available to meet all requirements during the coming winter months regardless of the weather conditions. The stockpiles level is a bearish factor for the energy commodity, even though another storm was bearing down on the Gulf Coast at the end of this week.
Natural gas rallies again on the back of another hurricane headed for the Gulf of Mexico
Hurricane Delta, the third significant storm of the season, was heading for the Gulf Coast on Thursday. The hurricane was strengthening and was expected to make landfall as a Category 2 storm at close to the same spot where Hurricane Laura hit in Louisiana six weeks ago. The latest forecasts are for arrival on Friday afternoon, October 9.
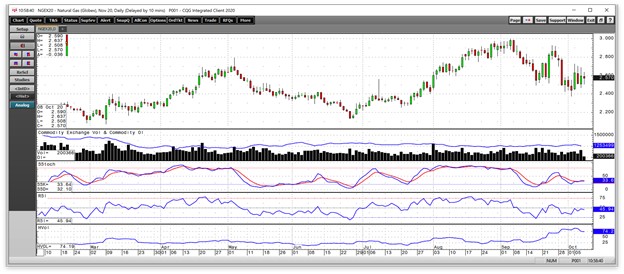
Source: CQG
As the chart shows, the nearby November natural gas futures contract was trading at the $2.57 per MMBtu level after the latest supply data. November futures have been making lower highs and lower lows since reaching $3.002 per MMBtu on September 4. They reached a low of $2.373 on October 2 and were trading below the midpoint of the recent range. The continuous contract reached a high of $2.789 after the October-November roll, which was shy of critical technical resistance at the November 2019 $2.905 peak.
The high level of stocks is likely weighing on the price of the energy commodity as we move towards the withdrawal season. A test of the late 2019 high could be challenging because of the natural gas market’s fundamentals.
Price momentum and relative strength on the daily chart were below neutral readings on October 8. Open interest has begun to edge lower, moving from 1.286 million to 1.253 million contracts since October 5. Daily historical volatility at over 74% remains elevated as daily price ranges have been wide.
The latest inventory report was a reminder that stockpiles could cap any attempts at rallies in the volatile natural gas market as they head towards an all-time high over the coming weeks.
Want More Great Investing Ideas?
7 Best ETFs for the NEXT Bull Market
What is the Cure for Stock Market Volatility?
Chart of the Day- See Christian Tharp’s Stocks Ready to Breakout
UNG shares were trading at $11.61 per share on Thursday afternoon, down $0.09 (-0.77%). Year-to-date, UNG has declined -31.14%, versus a 8.12% rise in the benchmark S&P 500 index during the same period.
About the Author: Andrew Hecht

Andy spent nearly 35 years on Wall Street and is a sought-after commodity and futures trader, an options expert and analyst. In addition to working with StockNews, he is a top ranked author on Seeking Alpha. Learn more about Andy’s background, along with links to his most recent articles. More...
More Resources for the Stocks in this Article
| Ticker | POWR Rating | Industry Rank | Rank in Industry |
| UNG | Get Rating | Get Rating | Get Rating |


