
- The market consensus was for the first withdrawal of the season of 28 bcf
- The earliest end to the injection season in years
- Stocks remain high- The election results could be weighing on the natural gas price
The nearby December natural gas futures contract made a new and higher high of $3.396 per MMBtu on the final day of October. Last month, the price of the energy commodity broke above its technical resistance level at the November 2019 $2.905 per MMBtu high. A series of storms that hit the US states along the Gulf of Mexico, cold weather conditions across vast areas of the US in late October, and the uncertainty of natural gas production in the aftermath of the 2020 Presidential election pushed the price higher.
In late June, nearby natural gas futures fell to a quarter-of-a-century low of $1.432 per MMBtu. Warren Buffett, the value investor, announced his Berkshire Hathaway acquired natural gas transmission and pipeline assets from Dominion Energy (D) in early July. The investment expanded Buffett’s control of natural gas transmission and pipelines from 8% to 18% across the US. In hindsight, the purchase ignited the rally in natural gas that took the price to its highest level since January 2019 last Friday.
The bullish price action continued, even though the Energy Information Administration reported that natural gas inventories reached 3.955 trillion cubic feet for the week ending on October 23. As of that date, stockpiles were already 223 bcf above the high at the end of the injection season in November 2013. Meanwhile, last year’s stock level at the end of the 2019 injection season weighed on the natural gas price.
The United States Natural Gas Fund (UNG) moves higher and lower with the price of natural gas futures on a short-term basis.
The market consensus was for the first withdrawal of the season of 28 bcf
The Energy Information Administration reported its first decline in stocks of the season for the week ending on October 30 when they reported data on November 5.
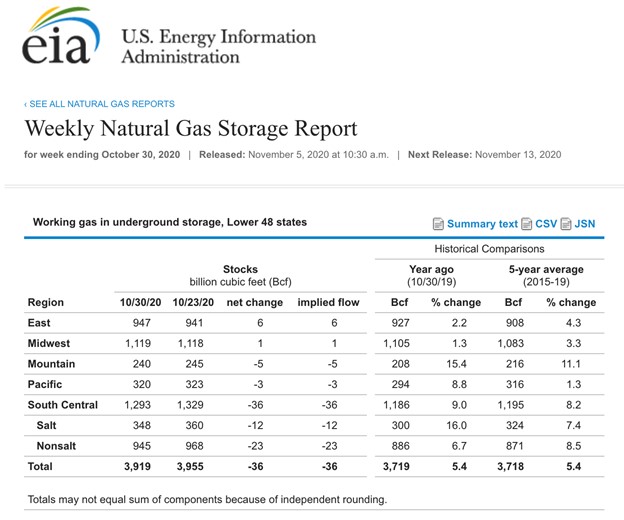
Source: EIA
As the chart highlights, the EIA reported a decline of 36 billion cubic feet, which was the first drop since March. Total stocks stood at 3.919 trillion cubic feet, 5.4% below last year’s level, and the five-year average for the end of October. The percentage of natural gas in storage above last year’s level declined to 5.4% in the latest report. Over the past thirty-one consecutive weeks, the percentage has steadily dropped from the previous week.
The earliest end to the injection season in years
The first withdrawal of the 2020/2021 peak season of demand came at the end of October, which was a few weeks earlier than the norm over the past years. Storms along the Gulf of Mexico and a blast of cold weather caused natural gas inventories to move lower from 3.955 trillion cubic feet, which now looks likely to stand as the peak level of supplies going in the winter months. While stockpiles will fall short of the record 4.047 tcf level and do not appear to be moving above the four tcf level before this coming winter, they were still 223 bcf above last year’s high. In 2019, stocks rose to 3.732 tcf, which was a high level compared to 3.234 tcf in 2019 and weighed on the natural gas price. In November 2019, the price only made it to a high of $2.905 per MMBtu. This year, the continuous contract already moved higher than that level as the most recent high was at $3.396 per MMBtu.
In 2019, the first withdrawal from inventories came during the week of November 15. In 2018, during the week of November 16, and in 2017 it was November 10. Therefore, a withdrawal as of October 30 was early in 2020.
Stocks remain high- The election results could be weighing on the natural gas price
At over 3.9 tcf, natural gas stocks remain high and enough to meet all requirements during the winter months. Inventories are ample even if there is a prolonged period of colder than average temperatures before the spring of 2021.
Meanwhile, in what seems like counter-intuitive price action, natural gas futures moved higher when inventories were still rising and, on the highs, reaching a peak at almost $3.40 per MMBtu.
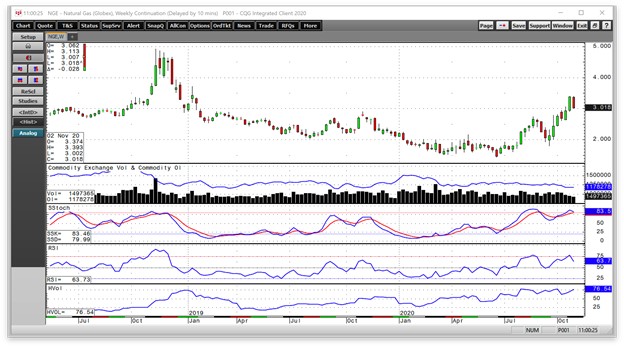
Source: CQG
As the monthly chart shows, before the first withdrawal of the season, the price of natural gas rose to the $3.396 high. On the day of the first decline in inventories, natural gas was back at the $3 level. Price momentum was in overbought territory on November 5 but appeared to be turning lower. Relative strength shifted lower and was heading for a neutral reading. Open interest, the total number of open long and short positions, has been drifting lower since late September.
One of the factors that could be weighing on the price of natural gas since the highs from last week could be the November 3 election results. Democrats favor limits or bans on fracking, while Republicans advocate for the opposite. While Joe Biden is close to winning the Presidential election, Republicans appear to have held their majority in the Senate. Republicans have also increased their presence in the House of Representatives, but the Democrats retain the majority. The bottom line is that the blue wave necessary to make significant US energy policy changes did not occur. Therefore, fracking is likely to continue, which will allow natural gas production to continue at the current levels. The most recent selloff in natural gas could be the result of the election that will not result in significant changes in the level of fracking.
The 2020/2021 withdrawal season began on the week ending on October 30. While the early start to the peak season and a high below four tcf in storage is somewhat bullish for the energy commodity, the election and future path of US energy policy could be a more potent force for the direction of the natural gas price.
Want More Great Investing Ideas?
Stocks Face SOARING Risk in November?
7 Best ETFs for the NEXT Bull Market
5 WINNING Stocks Chart Patterns
UNG shares were trading at $11.31 per share on Thursday afternoon, down $0.27 (-2.33%). Year-to-date, UNG has declined -32.92%, versus a 10.43% rise in the benchmark S&P 500 index during the same period.
About the Author: Andrew Hecht

Andy spent nearly 35 years on Wall Street and is a sought-after commodity and futures trader, an options expert and analyst. In addition to working with StockNews, he is a top ranked author on Seeking Alpha. Learn more about Andy’s background, along with links to his most recent articles. More...
More Resources for the Stocks in this Article
| Ticker | POWR Rating | Industry Rank | Rank in Industry |
| UNG | Get Rating | Get Rating | Get Rating |