- The market expected a 72 bcf injection for the week ending September 25
- Deferred prices remain at elevated levels
- A correction from the recent high- Watch for another higher low
Natural gas rolled from October to November futures at a substantial contango of over 60 cents per MMBtu. Contango is the forward premium in a market. The October-November spread reflected the move from the injection to withdrawal season in the natural gas market, beginning in early November.
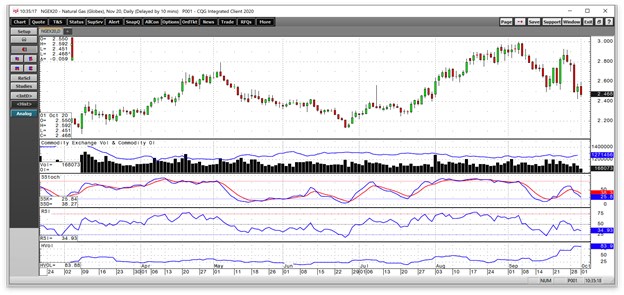
On September 24, the new active month November contract traded to a high of $2.928, above the high from November 2019, which was the seasonal peak at $2.905 per MMBtu. Since then, the price has moved steadily lower and was below the $2.60 level as the market went into the EIA’s weekly inventory data on Thursday, October 1. The November contract was moving towards the level where October was trading when it expired, which was just above $2.10 per MMBtu.
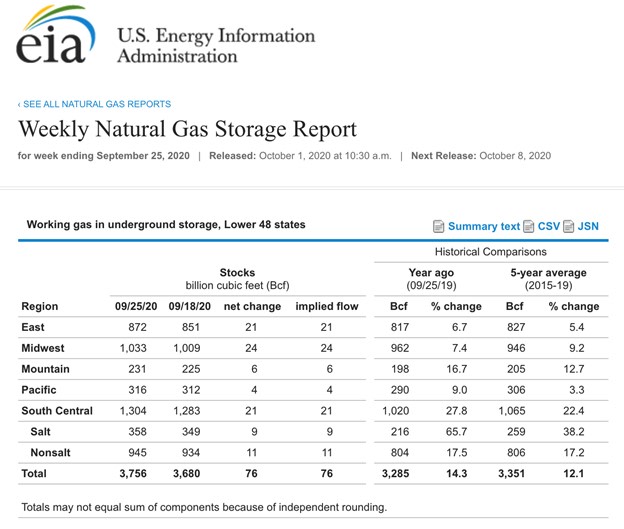
The market had expected an injection of around 70 billion cubic feet for the week ending on September 25. Anything injection over the 52 bcf level would push natural gas inventories above last year’s peak of 3.732 trillion cubic feet. The United States Natural Gas Fund (UNG) moves higher and lower with the price of the energy commodity.
The market expected a 72 bcf injection for the week ending September 25
The 72 bcf estimate for the rise in natural gas stockpiles for the week ending on September 25 came from Estimize, the crowdsourcing website. The injection was only slightly above that level.

Source: EIA
As the chart highlights, inventories rose by 76 billion cubic feet lifting stocks to 3.756 trillion cubic feet for the week ending on September 25. The level was 14.3% above last year’s level and 12.1% over the five-year average for the end of September. The percentage above last year’s level of natural gas supplies fell for the twenty-sixth consecutive week.
Meanwhile, with approximately seven weeks to go before the start of the withdrawal season, surpassing four trillion cubic feet in storage for the third time since the EIA began reporting inventories requires an average injection of only 34.9 bcf. Stocks will move into the 2020/2021 peak season of demand at the highest level in years, and perhaps a record level.
Deferred prices remain at elevated levels
The October natural gas futures contract rolled to November over the past week. At the time of the roll, the November futures commanded around a 60 cents premium to the October contract as November is the start of the withdrawal season when stocks decline.
Meanwhile, the price of the November futures contract corrected during the end of the roll.

Source: CQG
As the daily chart of the November contracts shows, the natural gas fell from its most recent high of $2.928 on September 24 to below $2.50 per MMBtu on October 1. Open interest has been sitting below 1.3 million contracts over the past two months. Price momentum and relative strength metrics were below neutral reading and leaning lower. Daily historical volatility fell to a low of below 22% in August and under 29% in September. The measure of price variance was at just under 84% on October 1. Daily trading ranges have increased as the winter months are just around the corner. The market did not have much of a reaction after the latest supply data as the price had already been declining since September 24.
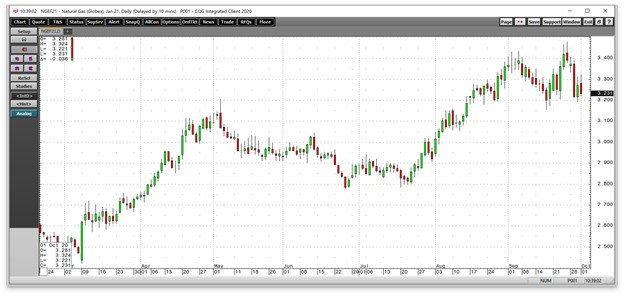
Last November, with stocks peaking at 3.732 tcf, lower than the level after the most recent injection, the natural gas price peaked at $2.905 per MMBtu. The price of peak season natural gas for delivery in January 2021 is already well above that level.

Source: CQG
January 2021 natural gas futures were above $3.20 per MMBtu on October 1. They were trading at an over 75 cents premium to the November futures. As inventories climb towards the four tcf level, we could see selling pressure increase in the natural gas futures arena.
A correction from the recent high- Watch for another higher low
The price of the now active month November future contract hit a high of $3.002 on September 4. The high in the continuous contract on the weekly chart stands at $2.789. Critical technical resistance remains at the November 2019 high of $2.905. On the downside, the first level of support on the November contract is at the July 20 low of $2.253 and the June 25 low of $2.133 per MMBtu. November futures traded to the June 25 low as the nearby contract hit a 25-year low at $1.432 per MMBtu.
I expect selling pressure to take natural gas to a high low over the coming days and weeks. As we head into the winter season and the November 3 election that could change the landscape for energy production in the US, I expect a pattern of higher lows in the November futures market. I would be surprised if the price of the energy commodity falls below the $2.133 over the final three months of 2020. However, I have learned that natural gas is a commodity that loves to hand out surprises.
Want More Great Investing Ideas?
Do NOT Buy Stocks Before the Election!
7 “Safe-Haven” Dividend Stocks for Turbulent Times
Chart of the Day- See Christian Tharp’s Stocks Ready to Breakout
UNG shares were trading at $11.02 per share on Thursday afternoon, down $0.39 (-3.42%). Year-to-date, UNG has declined -34.64%, versus a 6.16% rise in the benchmark S&P 500 index during the same period.
About the Author: Andrew Hecht

Andy spent nearly 35 years on Wall Street and is a sought-after commodity and futures trader, an options expert and analyst. In addition to working with StockNews, he is a top ranked author on Seeking Alpha. Learn more about Andy’s background, along with links to his most recent articles. More...
More Resources for the Stocks in this Article
| Ticker | POWR Rating | Industry Rank | Rank in Industry |
| UNG | Get Rating | Get Rating | Get Rating |


