

- The market expected a 20 bcf withdrawal from storage
- The peak for 2020 should be at 3.958 tcf- Plenty of natural gas to meet the demand during the coming months
- Natural gas falls and is limping into the winter season- January 5 could be a big day for the energy commodity
The week, the Energy Information Administration reported its natural gas inventory data one day early, on Wednesday, November 25, because of the Thanksgiving Day holiday. Typically, friends and families gather to enjoy a traditional turkey dinner with all of the trimmings. Thanksgiving marks the beginning of the holiday season and the start of the winter. 2020 is anything but an ordinary year as the number of coronavirus cases and hospitalizations are rising steadily. Many states in the US are encouraging people to limit gatherings to slow the spread of the virus.
Natural gas experienced a substantial rally after the price fell to a twenty-five-year low of $1.432 in late June. By the end of October, the price of the nearby NYMEX futures contract more than doubled when it reached a peak of $3.396 per MMBtu. November has been a month when natural gas tends to move higher. In 2019, it reached a peak of $2.905 per MMBtu, which stood as the high during the winter months. In November 2020, the price of natural gas has been experiencing selling pressure. Last week, the price dropped to a low of $2.525 per MMBtu.
The United States Natural Gas Fund (UNG - Get Rating) tracks the price of NYMEX futures.
The market expected a 20 bcf withdrawal from storage
The weekly storage data came in just a touch below the estimates from Estimize, a crowdsourcing website, when the EIA reported stockpile data on November 25. The data came out one day early because of the Thanksgiving holiday on Thursday.
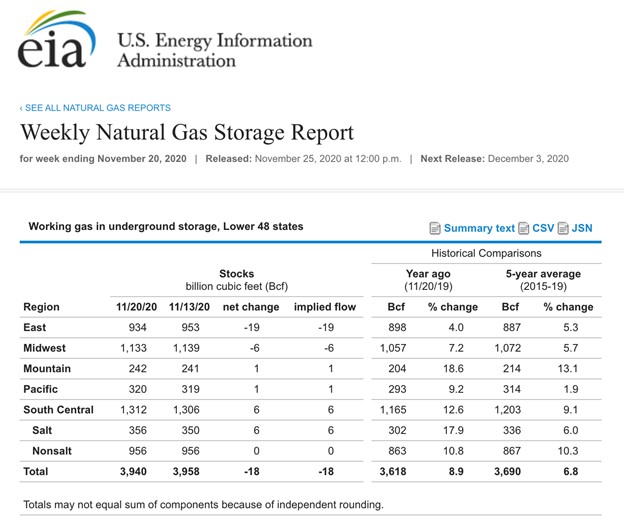
Source: EIA
As the chart shows, the EIA reported an 18 billion cubic feet decline in the amount of natural gas in storage across the United States for the week ending on November 20. Stockpiles are 8.9% above last year’s level and 6.8% over the five-year average for this time of the year. A total of 3.940 trillion cubic feet of natural gas were sitting in storage as we head into the winter months. The latest report should be the beginning of the withdrawal season, which typically runs through March.
The peak for 2020 should be at 3.958 tcf- Plenty of natural gas to meet the demand during the coming months
As of November 13, there were 3.958 tcf of natural gas in storage across the United States, which should be the peak for 2020. The high in 2019 was 3.732 tcf, 226 bcf lower than this year. In 2018, the high was 3.234 tcf, 724 bcf under this year’s level.
In 2019, the nearby NYMEX natural gas futures price reached a high of $2.905 because of the high level of stockpiles. The price fell to a twenty-five-year low in late June at $1.432 per MMBtu before recovering. One of the reasons for the lowest price in a quarter of a century was the high level of supplies in storage, which was substantially above the previous year from March throughout the injection season in 2020.
There is plenty of natural gas in storage to meet any challenge that Mother Nature’s weather throws at the market. Even if heating demand is far higher than over the past two years, stockpiles are at a level where supplies will meet requirements. The natural gas market’s price action in November reflects the high level of inventories.
Natural gas falls and is limping into the winter season- January 5 could be a big day for the energy commodity
After reaching a high of $3.396 on the nearby NYMEX natural gas futures contract on the final trading session of October, the energy commodity’s price turned lower.
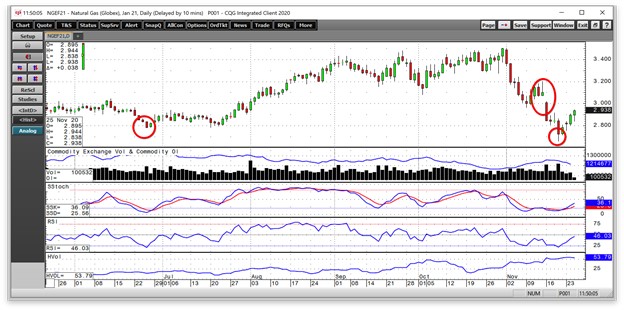
This week, December futures rolled to January, which is typically the contract that reflects the most significant level of seasonal demand for the winter months. January futures rose to a high of $3.507 per MMBtu on October 30 and fell to a low of $2.656 on November 19, the day that the nearby contract hit bottom at $2.525 per MMBtu.
Source: CQG
The daily chart of January futures shows that when nearby futures hit a low of $1.432 per MMBtu in late June, the January contract’s bottom was $2.778, a $1.346 premium or contango that reflected seasonality in the energy commodity. The most recent decline from $3.507 to a low of $2.656 on November 19 created a gap on the daily chart from $3.022 to $3.074 per MMBtu. Price action tends to fill voids on charts, and natural gas appears headed for erasing that gap after the latest EIA data. The price bounced from the November 19 low and was above the $2.90 level on November 25.
The total number of open long and short positions in the natural gas futures market declined from 1.259 million contracts on November 16 to 1.215 million on November 24 as the price of the energy commodity found at least a temporary bottom and reversed higher. Falling open interest and rising price is not a technical validation of an emerging bullish trend. However, gaps often have a magnetic force on prices, and the winter season is just beginning. The next level of technical resistance stands at the November 13 peak of $3.204. Above there, the October 30 high of $3.507 is critical technical resistance.
Daily price momentum and relative strength indicators crossed higher from oversold readings this week and are rising as the price recovers. Daily historical volatility at over 54% is at the highest level in 2020 as we head into the winter months in the natural gas market, which is the peak demand season.
The January 5 Senate runoff elections in Georgia will determine the majority in the US Senate. US energy policy is a critical issue for the coming years. Increased regulations that lead to less fracking and lower natural gas output would support the price of the energy commodity. We could see lots of volatility in natural gas price across the forward curve as the election approaches and in its aftermath.
Want More Great Investing Ideas?
9 “MUST OWN” Growth Stocks for 2021
Why Investors DON’T Care About Covid-19 Anymore
5 WINNING Stocks Chart Patterns
UNG shares were trading at $10.69 per share on Wednesday afternoon, up $0.22 (+2.10%). Year-to-date, UNG has declined -36.60%, versus a 14.35% rise in the benchmark S&P 500 index during the same period.
About the Author: Andrew Hecht

Andy spent nearly 35 years on Wall Street and is a sought-after commodity and futures trader, an options expert and analyst. In addition to working with StockNews, he is a top ranked author on Seeking Alpha. Learn more about Andy’s background, along with links to his most recent articles. More...
More Resources for the Stocks in this Article
| Ticker | POWR Rating | Industry Rank | Rank in Industry |
| UNG | Get Rating | Get Rating | Get Rating |


