
Atlantic American Corporation (AAME): Price and Financial Metrics
AAME Price/Volume Stats
| Current price | $1.75 | 52-week high | $2.84 |
| Prev. close | $1.75 | 52-week low | $1.25 |
| Day low | $1.75 | Volume | 227 |
| Day high | $1.75 | Avg. volume | 6,073 |
| 50-day MA | $1.57 | Dividend yield | 1.16% |
| 200-day MA | $1.60 | Market Cap | 35.60M |
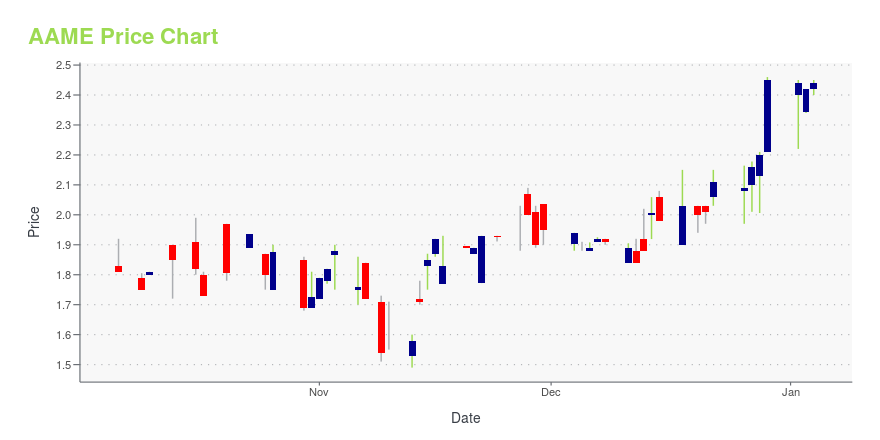
AAME Stock Price Chart Interactive Chart >
AAME Price Returns
| 1-mo | 9.38% |
| 3-mo | 17.90% |
| 6-mo | 4.17% |
| 1-year | -36.95% |
| 3-year | -39.56% |
| 5-year | -19.79% |
| YTD | 13.64% |
| 2024 | -36.59% |
| 2023 | 5.84% |
| 2022 | -3.92% |
| 2021 | 19.55% |
| 2020 | 4.57% |
AAME Dividends
| Ex-Dividend Date | Type | Payout Amount | Change | ||||||
|---|---|---|---|---|---|---|---|---|---|
| Loading, please wait... | |||||||||
Continue Researching AAME
Want to do more research on Atlantic American Corp's stock and its price? Try the links below:Atlantic American Corp (AAME) Stock Price | Nasdaq
Atlantic American Corp (AAME) Stock Quote, History and News - Yahoo Finance
Atlantic American Corp (AAME) Stock Price and Basic Information | MarketWatch
Loading social stream, please wait...